OPEN-SOURCE SCRIPT
Distance From moving average
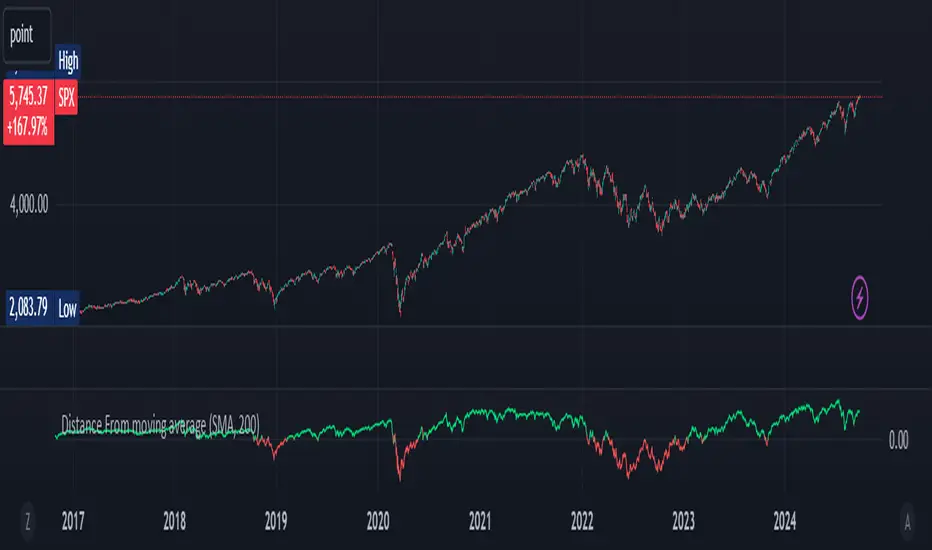
Distance From Moving Average is designed to help traders visualize the deviation of the current price from a specified moving average. Users can select from four different types of moving averages: Simple Moving Average (SMA), Exponential Moving Average (EMA), Weighted Moving Average (WMA), and Hull Moving Average (HMA).
Key Features:
User-Friendly Input Options:
Choose the type of moving average from a dropdown menu.
Set the length of the moving average, with a default value of 200.
Custom Moving Average Calculations:
The script computes the selected moving average using the appropriate mathematical formula, allowing for versatile analysis based on individual trading strategies.
Distance Calculation:
The indicator calculates the distance between the current price and the chosen moving average, providing insight into market momentum. A positive value indicates that the price is above the moving average, while a negative value shows it is below.
Visual Representation:
The distance is plotted on the chart, with color coding:
Lime: Indicates that the price is above the moving average (bullish sentiment).
Red: Indicates that the price is below the moving average (bearish sentiment).
Customization:
Users can further customize the appearance of the plotted line, enhancing clarity and visibility on the chart.
This indicator is particularly useful for traders looking to gauge market conditions and make informed decisions based on the relationship between current prices and key moving averages.
Skrip sumber terbuka
Dalam semangat TradingView sebenar, pencipta skrip ini telah menjadikannya sumber terbuka, jadi pedagang boleh menilai dan mengesahkan kefungsiannya. Terima kasih kepada penulis! Walaupuan anda boleh menggunakan secara percuma, ingat bahawa penerbitan semula kod ini tertakluk kepada Peraturan Dalaman.
Penafian
Maklumat dan penerbitan adalah tidak bertujuan, dan tidak membentuk, nasihat atau cadangan kewangan, pelaburan, dagangan atau jenis lain yang diberikan atau disahkan oleh TradingView. Baca lebih dalam Terma Penggunaan.