PROTECTED SOURCE SCRIPT
DSI - Dynamic Strength Index
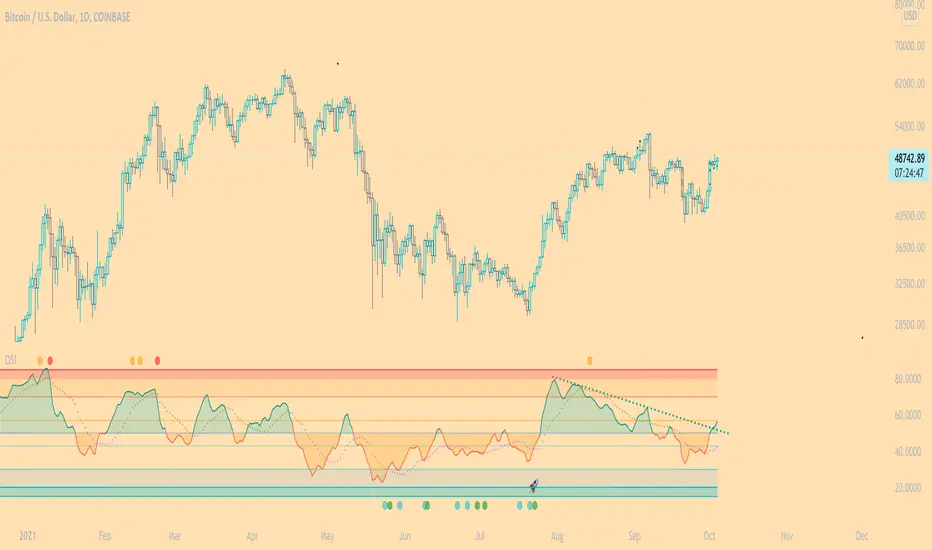
The DSI is a volume weighted momentum indicator similar but superior to the traditional RSI.
The DSI algorithm takes values for RSI, MFI, OBV and stochastics, then gives them each a different weighting depending on their historic reliability in different market conditions, and then averages out the values.
This results in a very reliable, noise-free momentum indicator, especially reliable on high timeframes.
Further features include:
Auto Trendlines - Up-downtrend lines to show support, resistance and breakouts
Supertrend- A momentum (ATR based) version of the Supertrend.
Divergences - Bullish and bearish momentum divergences, with confirmation signals.
General Rules:
Bullish above 50
Bearish below 50
Enjoy!
MM
Skrip dilindungi
Skrip ini diterbitkan sebagai sumber tertutup. Akan tetapi, anda boleh menggunakannya dengan percuma dan tanpa had – ketahui lebih lanjut di sini.
Penafian
Maklumat dan penerbitan adalah tidak dimaksudkan untuk menjadi, dan tidak membentuk, nasihat untuk kewangan, pelaburan, perdagangan dan jenis-jenis lain atau cadangan yang dibekalkan atau disahkan oleh TradingView. Baca dengan lebih lanjut di Terma Penggunaan.