OPEN-SOURCE SCRIPT
FSTO + MACD Combined Oscillator
FSTO + MACD Combined Oscillator with Advanced Alerts
Introduction
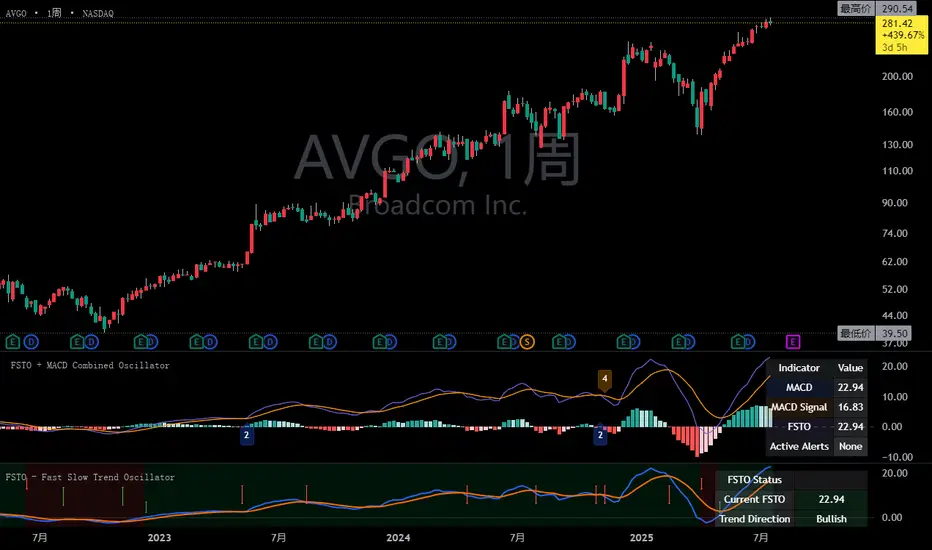
The FSTO + MACD Combined Oscillator is a powerful technical analysis tool that synergizes two proven momentum indicators to deliver high-confidence trading signals. By combining the Moving Average Convergence Divergence (MACD) with the Fast Slow Trend Oscillator (FSTO), this indicator provides unique insights into market momentum, trend direction, and potential reversal points.
Key Features
1. Dual Indicator Integration
MACD Component:
Fast EMA (user-configurable period)
Slow EMA (user-configurable period)
Signal line with customizable smoothing
Histogram showing momentum strength
FSTO Component:
Short-term EMA (price-based)
Long-term EMA (price-based)
Signal line with adjustable period
Zero-line crossover detection
2. Advanced Alert System
Four specialized alert conditions that trigger only when both indicators confirm momentum shifts:
Bullish Reversal Alert
FSTO crosses above zero + MACD transitions from falling to rising
Strong trend reversal signal
Bullish Momentum Alert
FSTO crosses above signal line + MACD transitions from falling to rising
Confirmation of bullish momentum
Bearish Reversal Alert
FSTO crosses below zero + MACD transitions from rising to falling
Strong trend reversal signal
Bearish Momentum Alert
FSTO crosses below signal line + MACD transitions from rising to falling
Confirmation of bearish momentum
3. Visual Indicators
Color-coded plots:
MACD line (blue)
MACD signal line (orange)
FSTO line (purple)
FSTO signal line (amber)
Histogram:
Green: Strengthening bullish momentum
Light green: Weakening bullish momentum
Red: Strengthening bearish momentum
Light red: Weakening bearish momentum
Alert markers:
Numbered labels (1-4) at chart extremes
Color-coded for quick identification
4. Information Panel
Real-time display of:
Current MACD and FSTO values
Trend direction (bullish/bearish)
Momentum status (rising/falling)
Active alerts with color coding
How It Works
The indicator calculates two parallel momentum measurements:
MACD = EMA(close, fast_length) - EMA(close, slow_length)
FSTO = EMA(close, short_period) - EMA(close, long_period)
The true power emerges when these indicators confirm each other's signals:
MACD detects momentum shifts in price derivatives
FSTO identifies trend changes in price itself
Combined signals filter out false positives
Trading Applications
1. Trend Identification
Bullish Trend: FSTO > 0 and MACD > signal line
Bearish Trend: FSTO < 0 and MACD < signal line
2. High-Probability Entries
Long Entry: Alert 1 or 2 triggers
Short Entry: Alert 3 or 4 triggers
3. Exit Signals
MACD histogram color change (green to light green)
FSTO crossing signal line against trend direction
4. Risk Management
Stop placement below recent swing low (bullish)
Stop placement above recent swing high (bearish)
Position sizing based on histogram strength
Recommended Settings
Market MACD Fast MACD Slow FSTO Short FSTO Long
Stocks 12 26 12 26
Cryptocurrency 10 20 10 20
Forex 8 17 8 17
Commodities 14 28 14 28
Benefits
Synergistic Signals: Combines price-based and derivative-based momentum
Reduced False Signals: Requires confirmation from both indicators
Customizable Alerts: Enable/disable specific alert types
Visual Clarity: Color-coded elements for quick interpretation
Multi-Timeframe: Works on all timeframes from 1-minute to monthly
How to Use
Add indicator to TradingView chart
Configure periods based on market and timeframe
Enable desired alerts in settings
Set up notifications through TradingView alert system
Combine with price action analysis for best results
The MACD + FSTO Combined Oscillator provides professional traders with a sophisticated yet intuitive tool for identifying high-probability trade setups across all financial markets. Its unique alert system ensures you never miss critical momentum shifts confirmed by dual-indicator analysis.
Introduction
The FSTO + MACD Combined Oscillator is a powerful technical analysis tool that synergizes two proven momentum indicators to deliver high-confidence trading signals. By combining the Moving Average Convergence Divergence (MACD) with the Fast Slow Trend Oscillator (FSTO), this indicator provides unique insights into market momentum, trend direction, and potential reversal points.
Key Features
1. Dual Indicator Integration
MACD Component:
Fast EMA (user-configurable period)
Slow EMA (user-configurable period)
Signal line with customizable smoothing
Histogram showing momentum strength
FSTO Component:
Short-term EMA (price-based)
Long-term EMA (price-based)
Signal line with adjustable period
Zero-line crossover detection
2. Advanced Alert System
Four specialized alert conditions that trigger only when both indicators confirm momentum shifts:
Bullish Reversal Alert
FSTO crosses above zero + MACD transitions from falling to rising
Strong trend reversal signal
Bullish Momentum Alert
FSTO crosses above signal line + MACD transitions from falling to rising
Confirmation of bullish momentum
Bearish Reversal Alert
FSTO crosses below zero + MACD transitions from rising to falling
Strong trend reversal signal
Bearish Momentum Alert
FSTO crosses below signal line + MACD transitions from rising to falling
Confirmation of bearish momentum
3. Visual Indicators
Color-coded plots:
MACD line (blue)
MACD signal line (orange)
FSTO line (purple)
FSTO signal line (amber)
Histogram:
Green: Strengthening bullish momentum
Light green: Weakening bullish momentum
Red: Strengthening bearish momentum
Light red: Weakening bearish momentum
Alert markers:
Numbered labels (1-4) at chart extremes
Color-coded for quick identification
4. Information Panel
Real-time display of:
Current MACD and FSTO values
Trend direction (bullish/bearish)
Momentum status (rising/falling)
Active alerts with color coding
How It Works
The indicator calculates two parallel momentum measurements:
MACD = EMA(close, fast_length) - EMA(close, slow_length)
FSTO = EMA(close, short_period) - EMA(close, long_period)
The true power emerges when these indicators confirm each other's signals:
MACD detects momentum shifts in price derivatives
FSTO identifies trend changes in price itself
Combined signals filter out false positives
Trading Applications
1. Trend Identification
Bullish Trend: FSTO > 0 and MACD > signal line
Bearish Trend: FSTO < 0 and MACD < signal line
2. High-Probability Entries
Long Entry: Alert 1 or 2 triggers
Short Entry: Alert 3 or 4 triggers
3. Exit Signals
MACD histogram color change (green to light green)
FSTO crossing signal line against trend direction
4. Risk Management
Stop placement below recent swing low (bullish)
Stop placement above recent swing high (bearish)
Position sizing based on histogram strength
Recommended Settings
Market MACD Fast MACD Slow FSTO Short FSTO Long
Stocks 12 26 12 26
Cryptocurrency 10 20 10 20
Forex 8 17 8 17
Commodities 14 28 14 28
Benefits
Synergistic Signals: Combines price-based and derivative-based momentum
Reduced False Signals: Requires confirmation from both indicators
Customizable Alerts: Enable/disable specific alert types
Visual Clarity: Color-coded elements for quick interpretation
Multi-Timeframe: Works on all timeframes from 1-minute to monthly
How to Use
Add indicator to TradingView chart
Configure periods based on market and timeframe
Enable desired alerts in settings
Set up notifications through TradingView alert system
Combine with price action analysis for best results
The MACD + FSTO Combined Oscillator provides professional traders with a sophisticated yet intuitive tool for identifying high-probability trade setups across all financial markets. Its unique alert system ensures you never miss critical momentum shifts confirmed by dual-indicator analysis.
Skrip sumber terbuka
Dalam semangat sebenar TradingView, pencipta skrip ini telah menjadikannya sumber terbuka supaya pedagang dapat menilai dan mengesahkan kefungsiannya. Terima kasih kepada penulis! Walaupun anda boleh menggunakannya secara percuma, ingat bahawa menerbitkan semula kod ini adalah tertakluk kepada Peraturan Dalaman kami.
Penafian
Maklumat dan penerbitan adalah tidak dimaksudkan untuk menjadi, dan tidak membentuk, nasihat untuk kewangan, pelaburan, perdagangan dan jenis-jenis lain atau cadangan yang dibekalkan atau disahkan oleh TradingView. Baca dengan lebih lanjut di Terma Penggunaan.