OPEN-SOURCE SCRIPT
Financial Astrology Mars Speed
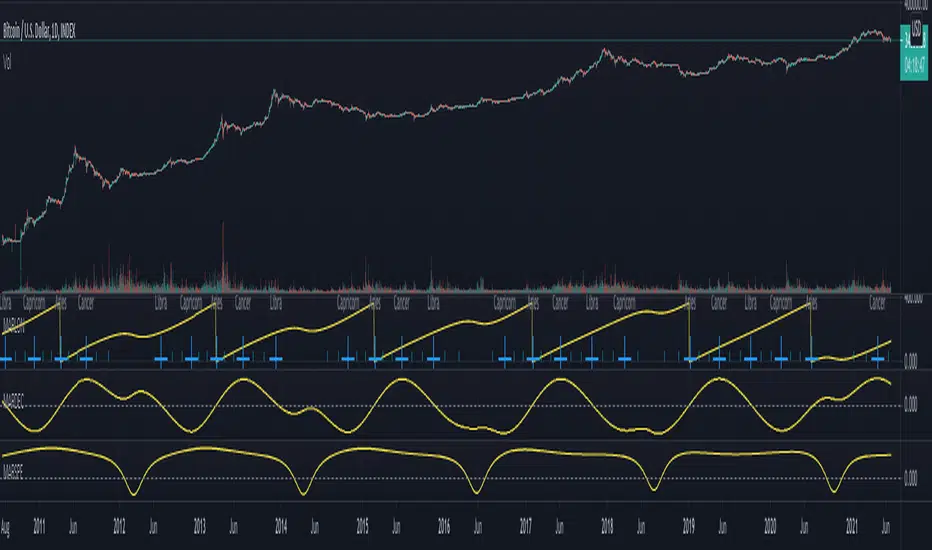
Mars speed phases (stationary and retrograde) seems to slow down the impulsive and energetic actions of traders, looking in the BTCUSD chart is very clear that during the period of Mars moving direct within the average speed around 0.6 degrees per day or above it, the price range is wider and the trend is more strong than when speed is decreasing below 0.50 degrees per day.
Surprisingly the price action acceleration don't happens at the maximum acceleration of Mars speed but after it reached the maxima around 0.75 to 0.76 degrees per day and stabilise around 0.7 for subsequent slow decrease through the course of few months to 0.62 - 0.58 daily speed range, during all this period the price action is strong. Once the Mars speed cross the 0.50 and goes into negative (in retrograde motion) the price suffers a congestion.
Note: The Mars speed indicator is based on an ephemeris array that covers years 2010 to 2030, prior or after this years the speed is not available, this daily ephemeris are based on UTC time so in order to align properly with the price bars times you should set UTC as your chart timezone.
Skrip sumber terbuka
Dalam semangat sebenar TradingView, pencipta skrip ini telah menjadikannya sumber terbuka supaya pedagang dapat menilai dan mengesahkan kefungsiannya. Terima kasih kepada penulis! Walaupun anda boleh menggunakannya secara percuma, ingat bahawa menerbitkan semula kod ini adalah tertakluk kepada Peraturan Dalaman kami.
Penafian
Maklumat dan penerbitan adalah tidak dimaksudkan untuk menjadi, dan tidak membentuk, nasihat untuk kewangan, pelaburan, perdagangan dan jenis-jenis lain atau cadangan yang dibekalkan atau disahkan oleh TradingView. Baca dengan lebih lanjut di Terma Penggunaan.