OPEN-SOURCE SCRIPT
Telah dikemas kini True Range/Expected Move

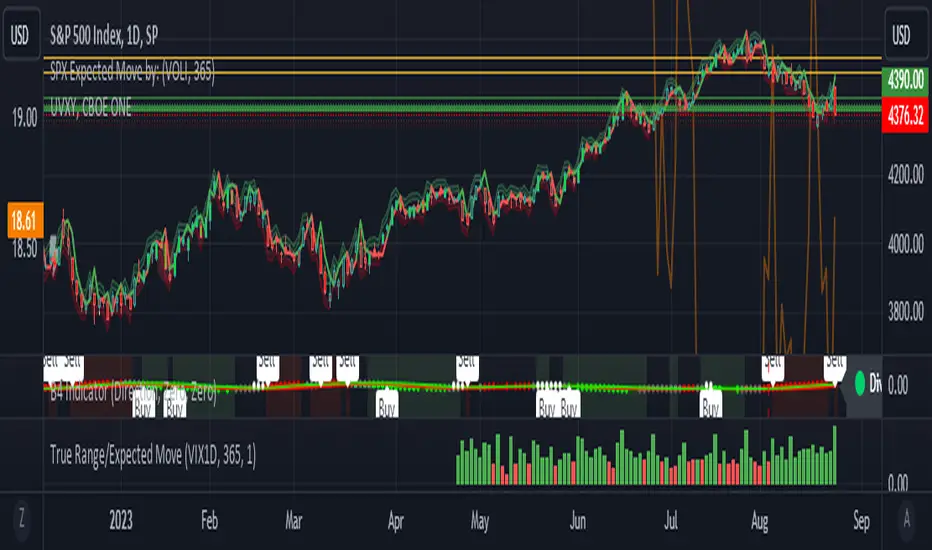
This indicator plots the ratio of True Range/Expected Move of SPX. True Range is simple the high-low range of any period. Expected move is the amount that SPX is predicted to increase or decrease from its current price based on the current level of implied volatility. There are several choices of volatility indexes to choose from. The shift in color from red to green is set by default to 1 but can be adjusted in the settings.
Red bars indicate the true range was below the expected move and green bars indicate it was above. Because markets tend to overprice volatility it is expected that there would be more red bars than green. If you sell SPX or SPY option premium red days tend to be successful while green days tend to get stopped out. On a 1D chart it is interesting to look at the clusters of bar colors.
Red bars indicate the true range was below the expected move and green bars indicate it was above. Because markets tend to overprice volatility it is expected that there would be more red bars than green. If you sell SPX or SPY option premium red days tend to be successful while green days tend to get stopped out. On a 1D chart it is interesting to look at the clusters of bar colors.
Nota Keluaran
Fixed the auto-range issue.Nota Keluaran
Added VIX1D to the list of volatility indexes.Skrip sumber terbuka
Dalam semangat sebenar TradingView, pencipta skrip ini telah menjadikannya sumber terbuka supaya pedagang dapat menilai dan mengesahkan kefungsiannya. Terima kasih kepada penulis! Walaupun anda boleh menggunakannya secara percuma, ingat bahawa menerbitkan semula kod ini adalah tertakluk kepada Peraturan Dalaman kami.
Penafian
Maklumat dan penerbitan adalah tidak dimaksudkan untuk menjadi, dan tidak membentuk, nasihat untuk kewangan, pelaburan, perdagangan dan jenis-jenis lain atau cadangan yang dibekalkan atau disahkan oleh TradingView. Baca dengan lebih lanjut di Terma Penggunaan.
Skrip sumber terbuka
Dalam semangat sebenar TradingView, pencipta skrip ini telah menjadikannya sumber terbuka supaya pedagang dapat menilai dan mengesahkan kefungsiannya. Terima kasih kepada penulis! Walaupun anda boleh menggunakannya secara percuma, ingat bahawa menerbitkan semula kod ini adalah tertakluk kepada Peraturan Dalaman kami.
Penafian
Maklumat dan penerbitan adalah tidak dimaksudkan untuk menjadi, dan tidak membentuk, nasihat untuk kewangan, pelaburan, perdagangan dan jenis-jenis lain atau cadangan yang dibekalkan atau disahkan oleh TradingView. Baca dengan lebih lanjut di Terma Penggunaan.