OPEN-SOURCE SCRIPT
Telah dikemas kini WaveTrend Oscillator [Krypt]
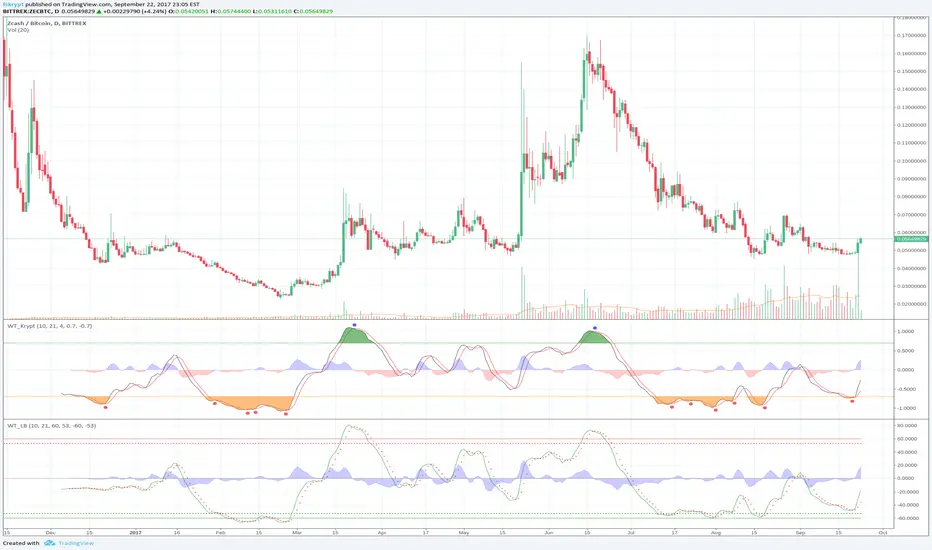
This is similar to regular WaveTrend Oscillator except:
- replaces hlc3 input with a weighted log formula for better stability/performance on high volatility charts
- zero-centered scaling
- SMA crossovers above and below OB/OS thresholds are marked as buy/sell signals
- replaces hlc3 input with a weighted log formula for better stability/performance on high volatility charts
- zero-centered scaling
- SMA crossovers above and below OB/OS thresholds are marked as buy/sell signals
Nota Keluaran
Use SMA curvature information to filter out buy/sell signals likely to be false positivesNota Keluaran
Rename some chart objectsNota Keluaran
Long/Short signal now captures some cases of bullish and bearish divergencesNota Keluaran
Use extra signal smoothing and extra momentum check for curvatureNota Keluaran
improve buy/sell signalsNota Keluaran
don't make helper elements editableNota Keluaran
start drawing signal earlier, perform averaging on cross steps for more stable bullish/bearish divergence detectionNota Keluaran
use a 1+2 formula for curvatureNota Keluaran
Default to lower smoothing to still show something on the chart in the beginningNota Keluaran
switch back to 4 for default SMA lengthNota Keluaran
Improve sensitivity in the beginning of the chartNota Keluaran
add commentNota Keluaran
Replace final EMA smoother with Ehlers' smoother for higher sensitivityNota Keluaran
Ignore first candleNota Keluaran
reduce default smoothing slightly and allow zero smoothingNota Keluaran
do not count MA cross above overbought level as bottom, and likewise do not count count MA cross below oversold level as top.Nota Keluaran
Simplify generation of buy/sell signalsNota Keluaran
fix how continues climb/descent is determinedNota Keluaran
detect hidden divergencesNota Keluaran
Update colors to make this indicator suitable for either light or dark T/V color modesNota Keluaran
quantitatively weigh bullish and bearish signalsSkrip sumber terbuka
Dalam semangat sebenar TradingView, pencipta skrip ini telah menjadikannya sumber terbuka supaya pedagang dapat menilai dan mengesahkan kefungsiannya. Terima kasih kepada penulis! Walaupun anda boleh menggunakannya secara percuma, ingat bahawa menerbitkan semula kod ini adalah tertakluk kepada Peraturan Dalaman kami.
Penafian
Maklumat dan penerbitan adalah tidak dimaksudkan untuk menjadi, dan tidak membentuk, nasihat untuk kewangan, pelaburan, perdagangan dan jenis-jenis lain atau cadangan yang dibekalkan atau disahkan oleh TradingView. Baca dengan lebih lanjut di Terma Penggunaan.
Skrip sumber terbuka
Dalam semangat sebenar TradingView, pencipta skrip ini telah menjadikannya sumber terbuka supaya pedagang dapat menilai dan mengesahkan kefungsiannya. Terima kasih kepada penulis! Walaupun anda boleh menggunakannya secara percuma, ingat bahawa menerbitkan semula kod ini adalah tertakluk kepada Peraturan Dalaman kami.
Penafian
Maklumat dan penerbitan adalah tidak dimaksudkan untuk menjadi, dan tidak membentuk, nasihat untuk kewangan, pelaburan, perdagangan dan jenis-jenis lain atau cadangan yang dibekalkan atau disahkan oleh TradingView. Baca dengan lebih lanjut di Terma Penggunaan.