PROTECTED SOURCE SCRIPT
Telah dikemas kini Vasyl Ivanov | Volatility by Extremums
"Volatility by Extremums" is an original technical indicator designed to measure market volatility based on the analysis of price extreme points. Unlike traditional volatility indicators that use standard statistical methods, this indicator calculates volatility as a percentage price change between local maximums and minimums, providing a more accurate understanding of actual price fluctuations in the market.
Unique Methodology
The indicator uses an innovative approach to volatility calculation:
Extremum Detection: The algorithm automatically identifies local maximums and minimums based on configurable parameters, including lookback period and minimum distance between extremums, measured in ATR (Average True Range) units.
Relative Volatility Calculation: For each pair of adjacent extremums, volatility is calculated using the formula: (|Max - Min| / Max) × 100%, where volatility is expressed as a percentage of the maximum value in the pair.
Result Aggregation: The indicator computes two key metrics:
Technical Parameters
Main Settings:
Visualization:
Practical Applications
Market Condition Analysis
The indicator helps traders identify:
Risk Management
Volatility data enables:
Trading Strategies
The indicator is effective for:
Advantages Over Traditional Indicators
Unlike standard volatility measures such as standard deviation or ATR, this indicator:
Focuses on actual extremums: Analyzes real price reversal points rather than abstract statistical indicators
Adapts to market conditions: Uses ATR to determine significant extremums, filtering market noise
Provides contextual information: Shows not only current volatility but also historical maximum, helping assess the relative significance of current movements
Usage Recommendations
Parameter Optimization:
Combining with Other Indicators:
Best results are achieved when used together with:
Technical Limitations
Users should consider:
"Volatility by Extremums" represents an innovative approach to market volatility analysis, providing traders with a unique tool for understanding price dynamics and making informed trading decisions based on actual market extremums.
Unique Methodology
The indicator uses an innovative approach to volatility calculation:
Extremum Detection: The algorithm automatically identifies local maximums and minimums based on configurable parameters, including lookback period and minimum distance between extremums, measured in ATR (Average True Range) units.
Relative Volatility Calculation: For each pair of adjacent extremums, volatility is calculated using the formula: (|Max - Min| / Max) × 100%, where volatility is expressed as a percentage of the maximum value in the pair.
Result Aggregation: The indicator computes two key metrics:
- Average volatility - arithmetic mean of all calculated volatility values
- Maximum volatility - highest volatility value between extremums during the analyzed period
Technical Parameters
Main Settings:
- Lookback (1000): Number of bars for historical analysis
- Extremums Bars Lookback (10): Period for extremum search
- Extremums Minimal Distance (2 ATR): Minimum distance between extremums for noise filtering
- ATR Period (30): Average True Range calculation period
- ATR Average Period (20): ATR averaging period
Visualization:
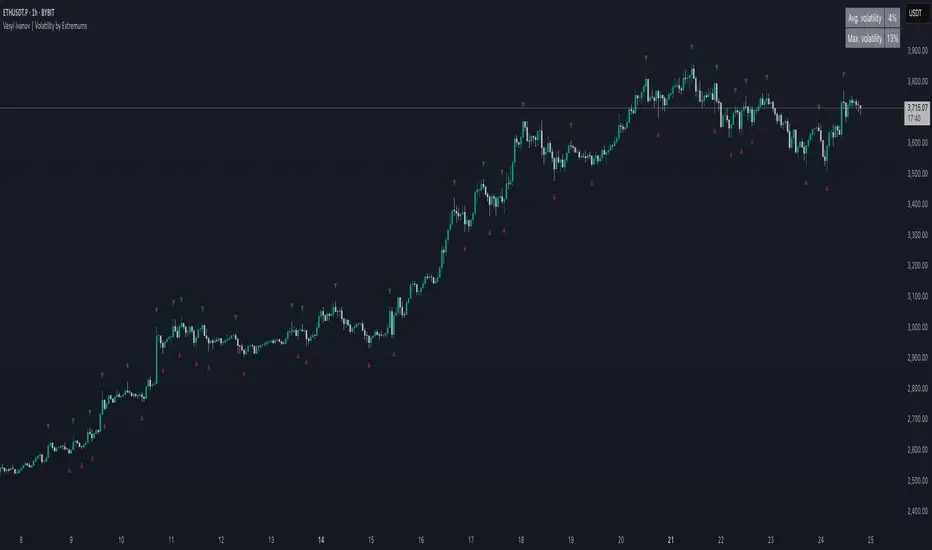
- Color-coded extremums: Bullish extremums marked in green, bearish in red
- Information table: Displays current average and maximum volatility values in the top-right corner of the chart
- Dynamic markers: Automatic placement of ▼ and ▲ symbols on corresponding extremums
Practical Applications
Market Condition Analysis
The indicator helps traders identify:
- High volatility periods: When average volatility exceeds historical norms, indicating potential for large price movements
- Consolidation phases: Low volatility values signal periods of energy accumulation before potential breakouts
- Extreme movements: Maximum volatility shows the largest price swings, which may indicate important market events
Risk Management
Volatility data enables:
- Position size adaptation based on current market volatility
- Dynamic stop-loss setting corresponding to market activity levels
- Optimal entry point selection during periods of reduced volatility
Trading Strategies
The indicator is effective for:
- Breakout strategies: Low volatility often precedes strong directional movements
- Counter-trend trading: Extremely high volatility values may signal potential reversals
- Scalping: Understanding current volatility level helps choose appropriate instruments and timeframes
Advantages Over Traditional Indicators
Unlike standard volatility measures such as standard deviation or ATR, this indicator:
Focuses on actual extremums: Analyzes real price reversal points rather than abstract statistical indicators
Adapts to market conditions: Uses ATR to determine significant extremums, filtering market noise
Provides contextual information: Shows not only current volatility but also historical maximum, helping assess the relative significance of current movements
Usage Recommendations
Parameter Optimization:
- For intraday trading: Reduce Lookback period to 200-500 bars
- For position trading: Increase minimum distance between extremums to 3-4 ATR
- For high-volatility assets: Set ATR period to shorter periods (14-21)
Combining with Other Indicators:
Best results are achieved when used together with:
- Trend indicators to determine overall market direction
- Oscillators for precise entry and exit timing
- Volume indicators to confirm movement strength
Technical Limitations
Users should consider:
- The indicator is based on historical data and does not guarantee future results
- Requires sufficient historical data for correct operation (minimum 100 bars)
- Most effective on liquid markets with clearly defined extremums
"Volatility by Extremums" represents an innovative approach to market volatility analysis, providing traders with a unique tool for understanding price dynamics and making informed trading decisions based on actual market extremums.
Nota Keluaran
Improved extremums detectionNota Keluaran
One more fix for extremums detectionNota Keluaran
improved first extremum detectionSkrip dilindungi
Skrip ini diterbitkan sebagai sumber tertutup. Akan tetapi, anda boleh menggunakannya secara bebas dan tanpa apa-apa had – ketahui lebih di sini.
Penafian
Maklumat dan penerbitan adalah tidak bertujuan, dan tidak membentuk, nasihat atau cadangan kewangan, pelaburan, dagangan atau jenis lain yang diberikan atau disahkan oleh TradingView. Baca lebih dalam Terma Penggunaan.
Skrip dilindungi
Skrip ini diterbitkan sebagai sumber tertutup. Akan tetapi, anda boleh menggunakannya secara bebas dan tanpa apa-apa had – ketahui lebih di sini.
Penafian
Maklumat dan penerbitan adalah tidak bertujuan, dan tidak membentuk, nasihat atau cadangan kewangan, pelaburan, dagangan atau jenis lain yang diberikan atau disahkan oleh TradingView. Baca lebih dalam Terma Penggunaan.