IldarAkhmetgaleev

Market Effectivity area v1

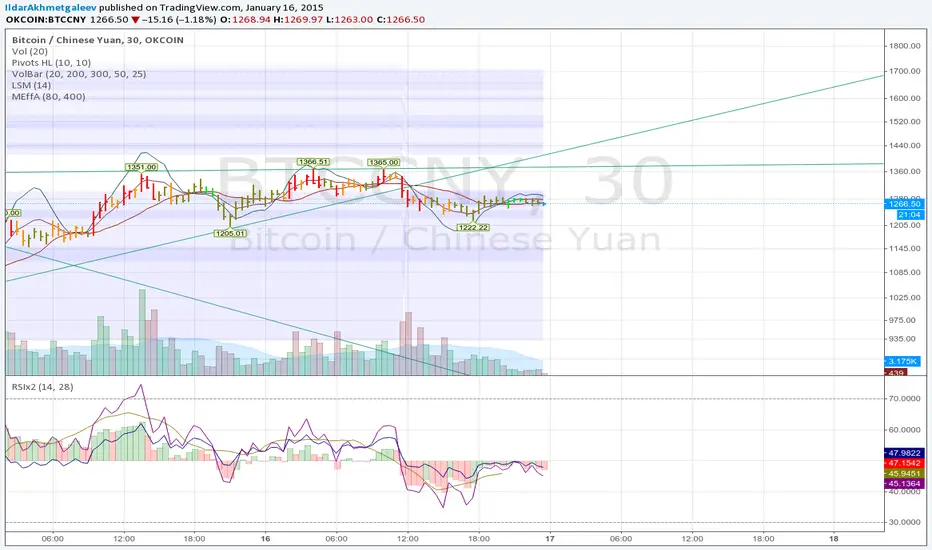
Cheap horizontal levels on chart

idea is: When spread is low and volume is high, then price is well accepted and will be retested in future. Areas without such "market efficiency" will be passed fast without stopping or rejected.
Skrip sumber terbuka

Dalam semangat TradingView yang sebenar, penulis skrip ini telah menerbitkannya dengan menggunakan sumber terbuka supaya pedagang-pedagang dapat memahami dan mengesahkannya. Sorakan kepada penulis! Anda dapat menggunakannya secara percuma tetapi penggunaan semula kod ini dalam penerbitan adalah dikawalselia oleh Peraturan Dalaman. Anda boleh menyukainya untuk menggunakannya pada carta.

Penafian

Maklumat dan penerbitan adalah tidak dimaksudkan untuk menjadi, dan tidak membentuk, nasihat untuk kewangan, pelaburan, perdagangan dan jenis-jenis lain atau cadangan yang dibekalkan atau disahkan oleh TradingView. Baca dengan lebih lanjut di Terma Penggunaan.

Ingin menggunakan skrip ini pada carta?
study(title="Market Effectivity area", shorttitle="MEffA", overlay=true)
std_len = input(80, minval=5, title='Deviation lenght')
thresshold = input(400, minval=100, title='Thresshold') / 100

line_color = #eeeeff
area_color = #7777ff
area_transp = 87

highvol = volume > stdev(volume, std_len) * thresshold
top = highvol ? high : top[1]
bottom = highvol ? low : bottom[1]

tl = plot(top, color=line_color, style=circles)
bl = plot(bottom, color=line_color, style=circles)
fill(tl, bl, color=area_color, transp=area_transp)

// echo
t_1 = top[1] != top ? top[1] : t_1[1]
b_1 = bottom[1] != bottom ? bottom[1] : b_1[1]
tl_1 = plot(t_1, color=line_color, style=circles)
bl_1 = plot(b_1, color=line_color, style=circles)
fill(tl_1, bl_1, color=area_color, transp=area_transp+1)

t_2 = t_1[1] != t_1 ? t_1[1] : t_2[1]
b_2 = b_1[1] != b_1 ? b_1[1] : b_2[1]
tl_2 = plot(t_2, color=line_color, style=circles)
bl_2 = plot(b_2, color=line_color, style=circles)
fill(tl_2, bl_2, color=area_color, transp=area_transp+1)

t_3 = t_2[1] != t_2 ? t_2[1] : t_3[1]
b_3 = b_2[1] != b_2 ? b_2[1] : b_3[1]
tl_3 = plot(t_3, color=line_color, style=circles)
bl_3 = plot(b_3, color=line_color, style=circles)
fill(tl_3, bl_3, color=area_color, transp=area_transp+2)

t_4 = t_3[1] != t_3 ? t_3[1] : t_4[1]
b_4 = b_3[1] != b_3 ? b_3[1] : b_4[1]
tl_4 = plot(t_4, color=line_color, style=circles)
bl_4 = plot(b_4, color=line_color, style=circles)
fill(tl_4, bl_4, color=area_color, transp=area_transp+2)

t_5 = t_4[1] != t_4 ? t_4[1] : t_5[1]
b_5 = b_4[1] != b_4 ? b_4[1] : b_5[1]
tl_5 = plot(t_5, color=line_color, style=circles)
bl_5 = plot(b_5, color=line_color, style=circles)
fill(tl_5, bl_5, color=area_color, transp=area_transp+3)

t_6 = t_5[1] != t_5 ? t_5[1] : t_6[1]
b_6 = b_5[1] != b_5 ? b_5[1] : b_6[1]
tl_6 = plot(t_6, color=line_color, style=circles)
bl_6 = plot(b_6, color=line_color, style=circles)
fill(tl_6, bl_6, color=area_color, transp=area_transp+3)

t_7 = t_6[1] != t_6 ? t_6[1] : t_7[1]
b_7 = b_6[1] != b_6 ? b_6[1] : b_7[1]
tl_7 = plot(t_7, color=line_color, style=circles)
bl_7 = plot(b_7, color=line_color, style=circles)
fill(tl_7, bl_7, color=area_color, transp=area_transp+4)

t_8 = t_7[1] != t_7 ? t_7[1] : t_8[1]
b_8 = b_7[1] != b_7 ? b_7[1] : b_8[1]
tl_8 = plot(t_8, color=line_color, style=circles)
bl_8 = plot(b_8, color=line_color, style=circles)
fill(tl_8, bl_8, color=area_color, transp=area_transp+4)

t_9 = t_8[1] != t_8 ? t_8[1] : t_9[1]
b_9 = b_8[1] != b_8 ? b_8[1] : b_9[1]
tl_9 = plot(t_9, color=line_color, style=circles)
bl_9 = plot(b_9, color=line_color, style=circles)
fill(tl_9, bl_9, color=area_color, transp=area_transp+5)

t_10 = t_9[1] != t_9 ? t_9[1] : t_10[1]
b_10 = b_9[1] != b_9 ? b_9[1] : b_10[1]
tl_10 = plot(t_10, color=line_color, style=circles)
bl_10 = plot(b_10, color=line_color, style=circles)
fill(tl_10, bl_10, color=area_color, transp=area_transp+5)

t_11 = t_10[1] != t_10 ? t_10[1] : t_11[1]
b_11 = b_10[1] != b_10 ? b_10[1] : b_11[1]
tl_11 = plot(t_11, color=line_color, style=circles)
bl_11 = plot(b_11, color=line_color, style=circles)
fill(tl_11, bl_11, color=area_color, transp=area_transp+6)

t_12 = t_11[1] != t_11 ? t_11[1] : t_12[1]
b_12 = b_11[1] != b_11 ? b_11[1] : b_12[1]
tl_12 = plot(t_12, color=line_color, style=circles)
bl_12 = plot(b_12, color=line_color, style=circles)
fill(tl_12, bl_12, color=area_color, transp=area_transp+6)