OPEN-SOURCE SCRIPT
Telah dikemas kini + WaveTrend Oscillator Overlay
An overlay version of pertinent signals from my version of LazyBear's Wavetrend Oscillator.
Shows momentum of long period WTO as either background colors or symbols.
Shows continuation and reversal trade signals.
If Secondary WTO is above the center line (momentum is long), then symbols print across the top of the chart when the primary (faster) WTO comes into "oversold," a number associated with a horizontal line on the off-chart indicator. This number is selectable via a drop-down menu. Same thing for bearish momentum.
Conversely, reversal signals are printed along the bottom when conditions are met. Ex: if the Secondary WTO is showing momentum is bullish, then symbols will print along the bottom when the primary WTO is at "overbought" (or whatever number you deem overbought--again, via a similar drop-down menu).
Also, symbols are printed above and below candles for when the moving average of the primary WTO is crossed.
You could use these for taking profits, exiting a trade, or entering a trade.
Includes a moving average that is an average of the 200 EMA, SMA and Kijun.
Alerts.
Enjoy.
//p.s. I recommend using this in conjunction with my "+ Wavetrend Oscillator" at least starting out. Helps to have a visual
//reference when picking reversal and continuation numbers.
Nota Keluaran
- updated to pinescript version 5- fixed an issue with reversal and continuation signals printing (can't even believe I let the first version go out like that, but no one bothered to bring it to my attention, so....)
- reversal and continuation signals now by default print bullish along bottom of chart and bearish across the top... obviously you the user can change this
- added non gradient candle colors, meaning if either WaveTrend is above 0 the color is whatever you assign it as bullish, and vice versa for below 0 being bearish
Nota Keluaran
I'm publishing updates to all of my indicators, so I'm just going to comment on everything here since most of the updates are common across most of my indicators.Specific to the Wavetrend Overlay I've fixed an issue in the code on the second wavetrend that was making it calculate wrong. Also added some alert conditions.
User Non-Visible Updates (basically backend stuff that makes:
- changes in code legibility and consistency across all indicators (basically standardizing the coding across as many indicators as possible)
- implementation of libraries into my indicators; which helps significantly in doing what I typed above; which in turn will make creating any new indicators, if they are of the type to use these libraries, much simpler
- updated descriptions for all indicators, which should (it's possible I've forgotten things) reflect changes I've made recently and any I may have made in the past after first publication (this is very minor, but as I was changing so much I thought I may as well--I don't intend to update these much, if at all, in the future)
User Visible Updates:
- as I mentioned everything now uses my moving averages library and volatility bands library--this cuts down the total amount of code significantly, and has made it easier for me to add moving averages, or volatility bands to these indicators because I only had to/have to add it one time (to the library) rather than multiple times across all indicators*
- since creating these libraries I've added several new moving averages (Kaufman Adaptive, Laguerre Filter, McGinley Dynamic (doesn't work for all), and Zero-lag) to them while retaining all the previous with the exception of the UMA, which wasn't implemented consistently across all indicators anyway
- eliminated having two Bollinger Bands with different standard deviations and a fill between them in exchange for one with the band fill implementation that I use on my Donchian Channels Bands
- part of my code consistency across all indicators resulted in a much needed organization of the 'style' tab
*(affects all but the Wavetrend Oscillator, Wavetrend Oscillator Overlay, Jurik KDJ, Average Candle Bodies Range, Bollinger Bands Width, ALMA Trend Detector, Ultimate Moving Average, Donchian Channels, and Dynamic Donchian Channels)
Nota Keluaran
This is a big update!- updated to pinescript v6
- cleaned up the code ALOT to make it more inline with TradingView recommendations, and also to make it more legible for those who wish to read it
- reorganized the UI a bit. Should be a lot simpler and cleaner while giving you the information you need
- added much-needed tooltips in places where I should have before, like to explain what I mean by continuations and reversals, or at least how they are defined by this indicator
- added a color-timeframe input so that you can have your indicator colored based on an alternate timeframe even while looking at it on the current timeframe. This can be helpful because based on color information you can see that you are in a downtrend on a higher timeframe, and while watching the indicator on the current timeframe you might observe that price is overbought so might decide to open a short. This is convenient. I've done this with all my indicators, but I think it's especially handy here when used in combination with the below-chart indicator. Honestly tempted to make overlays for all my indicators. lol
- updated divergences to TradingView's most up-to-date version. This is also an add. I did not have divergences on the overlay in earlier versions.
I think that's about all!
Please enjoy!
Nota Keluaran
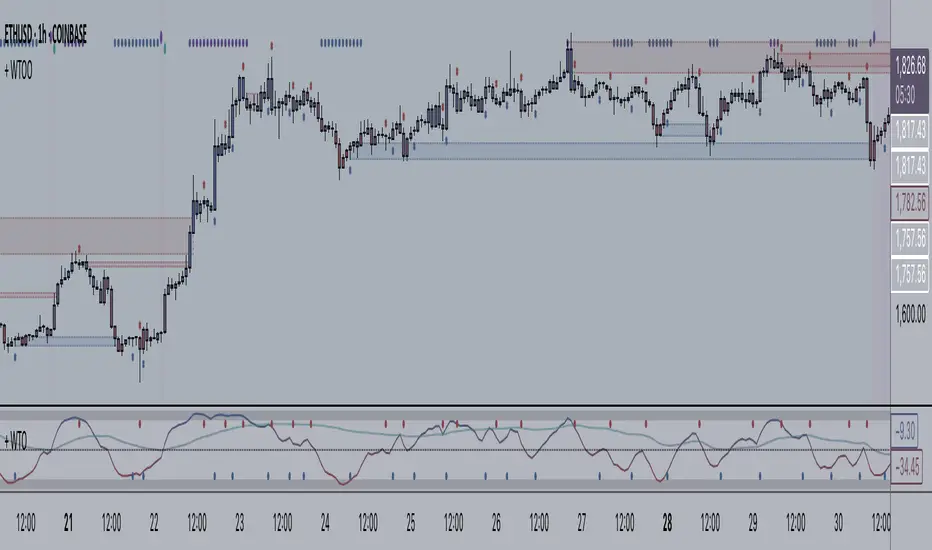
As I updated my Stochastic S/R Zones indicator recently, I thought since the Wavetrend Oscillator is so similar to the Stochastic I might incorporate that code into my Wavetrend overlay. The eyeball test says it might work better than the the stochastic.So, what is it? The WTO can produce some interesting and useful signals when it comes out of "overbought" or "oversold." (Having an idea of whether the market is ranging or trending can be very helpful in interpreting these "signals.") These signals can be used to determine when one might want to be long or short.
The way this part of the indicator works is that when the oscillator comes out of overbought/sold a box is drawn starting from the previous bar until price closes below support or above resistance. I'm using 60 and -60 as overbought/sold values as they are extreme values without being too extreme (meaning they produce adequate enough "signals"--more extreme values would produce too few, and values closer to center I think would produce too many). These zones work pretty well in this regard.
Expect in trending environments for resistance and support to be broken, but in ranging market conditions support and resistance holds up pretty well.
Additional screenshots:
Skrip sumber terbuka
Dalam semangat TradingView sebenar, pencipta skrip ini telah menjadikannya sumber terbuka, jadi pedagang boleh menilai dan mengesahkan kefungsiannya. Terima kasih kepada penulis! Walaupuan anda boleh menggunakan secara percuma, ingat bahawa penerbitan semula kod ini tertakluk kepada Peraturan Dalaman.
Penafian
Maklumat dan penerbitan adalah tidak bertujuan, dan tidak membentuk, nasihat atau cadangan kewangan, pelaburan, dagangan atau jenis lain yang diberikan atau disahkan oleh TradingView. Baca lebih dalam Terma Penggunaan.