OPEN-SOURCE SCRIPT
Coppock Curve
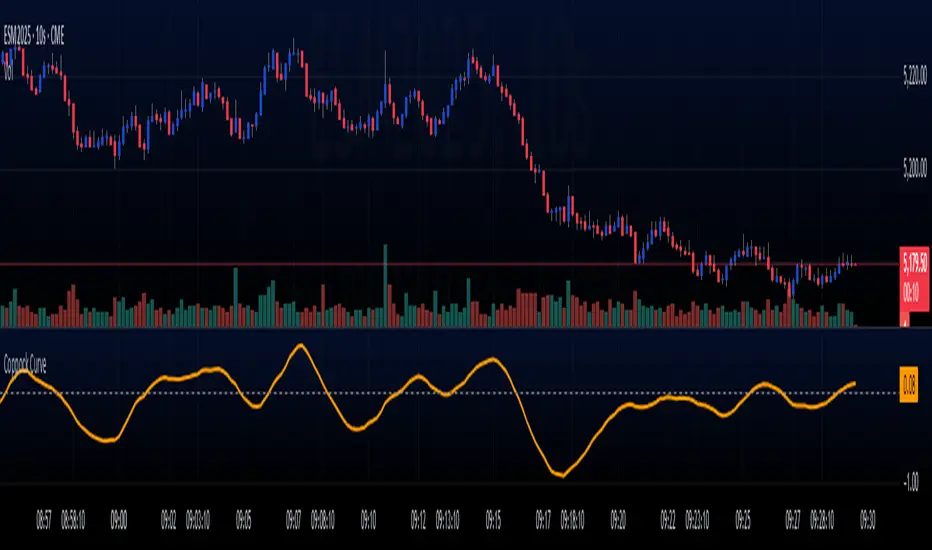
The Coppock Curve is a long-term momentum indicator, also known as the "Coppock Guide," used to identify potential long-term market turning points, particularly major downturns and upturns, by smoothing the sum of 14-month and 11-month rates of change with a 10-month weighted moving average.
Here's a more detailed breakdown:
What it is:
The Coppock Curve is a technical indicator designed to identify long-term buy and sell signals in major stock market indices and related ETFs.
How it's calculated:
Rate of Change (ROC): The indicator starts by calculating the rate of change (ROC) for 14 and 11 periods (usually months).
Sum of ROCs: The ROC for the 14-period and 11-period are summed.
Weighted Moving Average (WMA): A 10-period weighted moving average (WMA) is then applied to the sum of the ROCs.
Interpreting the Curve:
Buy Signals: A buy signal is often generated when the Coppock Curve crosses above the zero line, suggesting a potential transition from a bearish to a bullish phase.
Sell Signals: While primarily designed to identify market bottoms, some traders may interpret a cross below the zero line as a sell signal or a bearish warning.
Origin and Purpose:
The Coppock Curve was introduced by economist Edwin Coppock in 1962.
It was originally designed to help investors identify opportune moments to enter the market.
Coppock's inspiration came from the Episcopal Church's concept of the average mourning period, which he believed mirrored the stock market's recovery period.
Limitations:
The Coppock Curve is primarily used for long-term analysis and may not be as effective for short-term or intraday trading.
It may lag in rapidly changing markets, and its signals may not always be reliable.
Skrip sumber terbuka
Dalam semangat TradingView sebenar, pencipta skrip ini telah menjadikannya sumber terbuka, jadi pedagang boleh menilai dan mengesahkan kefungsiannya. Terima kasih kepada penulis! Walaupuan anda boleh menggunakan secara percuma, ingat bahawa penerbitan semula kod ini tertakluk kepada Peraturan Dalaman.
Penafian
Maklumat dan penerbitan adalah tidak bertujuan, dan tidak membentuk, nasihat atau cadangan kewangan, pelaburan, dagangan atau jenis lain yang diberikan atau disahkan oleh TradingView. Baca lebih dalam Terma Penggunaan.