OPEN-SOURCE SCRIPT
Telah dikemas kini Monthly Weekly Daily Hourly CLOSES
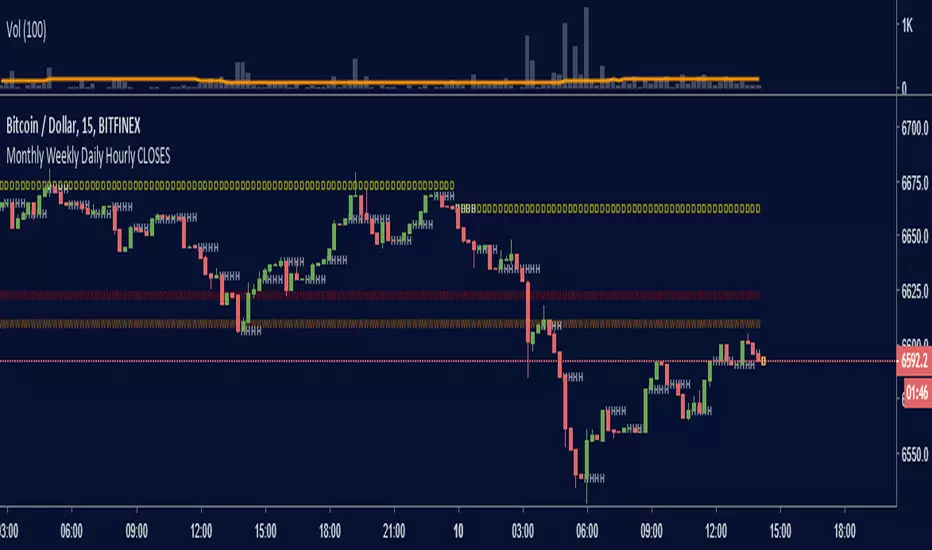
Draws horizontal segments where the last Monthly, Weekly, Daily and Hourly closes are.
Easily identify current price relative position to these key prices.
I use it as a kind of pivot points and help me with trend following entries: longs if up from last close, shorts if down from last close.
Monthly: red line (MMMMM)
Weekly: orange line (WWWWW)
Daily: yellow line (DDDDD)
Hourly: white line (HHHHH)
//Original idea from "Key Levels [treypeng]
Nota Keluaran
Added high / low for each periodAdjusted colors and character for visibility
Skrip sumber terbuka
Dalam semangat TradingView sebenar, pencipta skrip ini telah menjadikannya sumber terbuka, jadi pedagang boleh menilai dan mengesahkan kefungsiannya. Terima kasih kepada penulis! Walaupuan anda boleh menggunakan secara percuma, ingat bahawa penerbitan semula kod ini tertakluk kepada Peraturan Dalaman.
Penafian
Maklumat dan penerbitan adalah tidak bertujuan, dan tidak membentuk, nasihat atau cadangan kewangan, pelaburan, dagangan atau jenis lain yang diberikan atau disahkan oleh TradingView. Baca lebih dalam Terma Penggunaan.