OPEN-SOURCE SCRIPT
WLD Estrategia Compra/Venta Multi Indicadores
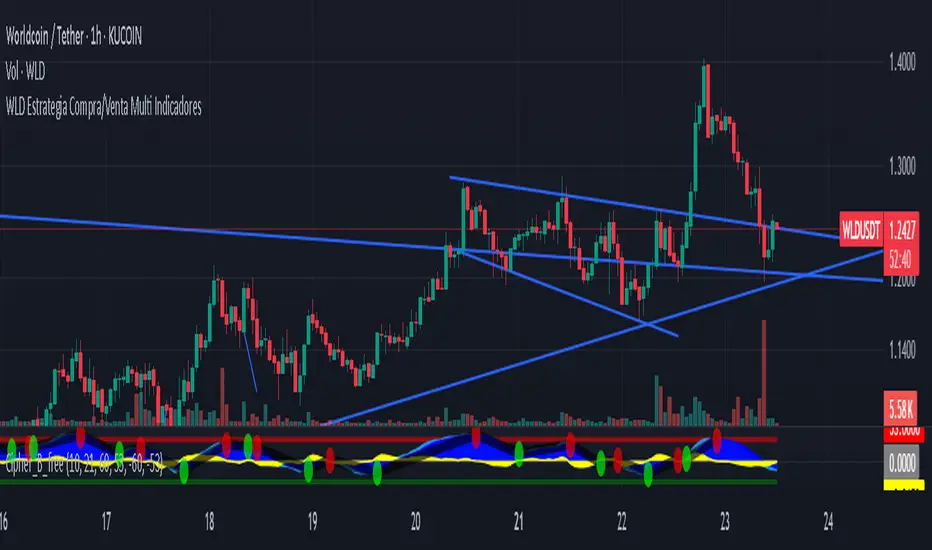
A BUY signal is only triggered when all the following are true:
RSI < 30
Indicates oversold territory—potential for a bounce.
MACD crossover upward
The MACD line crosses above the signal line, a bullish momentum shift.
MA50 > MA200
Confirms an overall bullish trend (Golden Cross).
Price below lower Bollinger Band
Shows price is at an extreme low (potential reversal zone).
Stochastic RSI < 20
Adds confirmation of short-term oversold condition.
When all are true simultaneously, a BUY signal is triggered.
A SELL signal is triggered when all the following are true:
RSI > 70
Indicates the asset is overbought—risk of pullback.
MACD crossover downward
The MACD line crosses below the signal line—bearish shift.
MA50 < MA200
Confirms a bearish trend (Death Cross).
Price above upper Bollinger Band
Suggests price is at an extreme high—potential exhaustion.
Stochastic RSI > 80
Confirms short-term overbought momentum.
When all conditions align, a SELL signal is triggered.
Skrip sumber terbuka
Dalam semangat sebenar TradingView, pencipta skrip ini telah menjadikannya sumber terbuka supaya pedagang dapat menilai dan mengesahkan kefungsiannya. Terima kasih kepada penulis! Walaupun anda boleh menggunakannya secara percuma, ingat bahawa menerbitkan semula kod ini adalah tertakluk kepada Peraturan Dalaman kami.
Penafian
Maklumat dan penerbitan adalah tidak dimaksudkan untuk menjadi, dan tidak membentuk, nasihat untuk kewangan, pelaburan, perdagangan dan jenis-jenis lain atau cadangan yang dibekalkan atau disahkan oleh TradingView. Baca dengan lebih lanjut di Terma Penggunaan.