PROTECTED SOURCE SCRIPT
Capitulation Finder By MChiestes
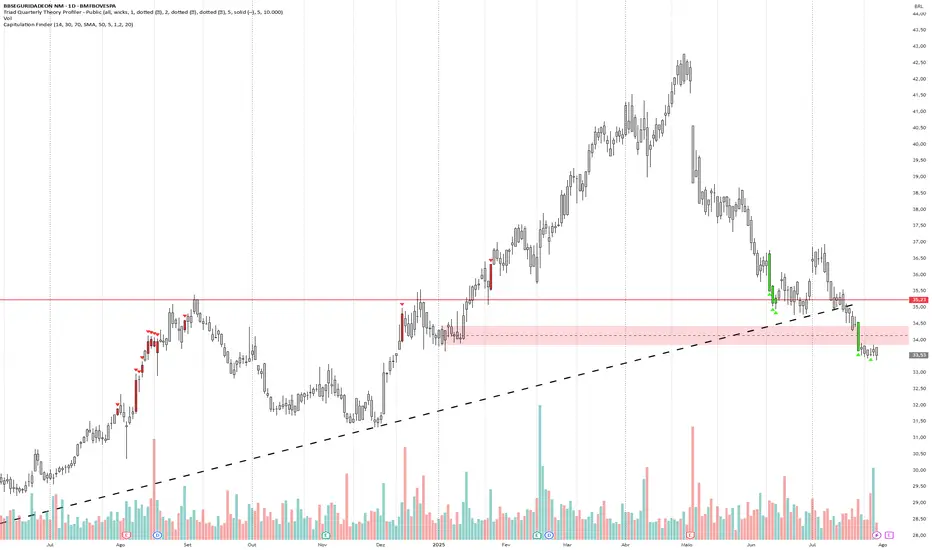
The **'Capitulation Finder' indicator** is designed to detect extreme market exhaustion points—moments when selling or buying is so intense that a major price reversal may be near. It combines several technical factors to highlight likely "capitulation" events, which traditionally signal *market bottoms* (bullish capitulation) or *tops* (bearish capitulation), using both momentum and volume conditions[1][4][6].
**Input Parameters:**
- **RSI Length / Level:** Controls sensitivity to price momentum. Capitulation is flagged when RSI is oversold (e.g., ≤30) or overbought (e.g., ≥70).
- **Moving Average Type / Length:** Lets you choose as baseline (e.g., SMA, EMA) and its lookback period for price deviation calculations.
- **Distance from MA (%):** Sets how far price must stray from the MA (in %) to meet "extreme" conditions.
- **Volume Multiplier / Avg Length:** Requires the current volume to greatly exceed normal (average) volume, confirming broad market participation.
**How the Indicator Works:**
- **Bullish Capitulation:** Triggers when...
- RSI is *very low* (oversold).
- Price is **well below** the chosen MA by the input %, indicating a sharp drop.
- Current volume is **much greater** (e.g., 1.2x or more) than the average, confirming widespread panic selling.
- **Bearish Capitulation:** Triggers when...
- RSI is *very high* (overbought).
- Price is **well above** the MA, indicating a possible buyer frenzy.
- Volume also spikes, confirming conviction in the move.
**Additional Confirmations:**
Isolated checks also register when just the RSI and volume triggers are met, without considering price-MA distance. This helps identify milder extremes for early warning.
**Visual & Signal Output:**
- **Candle Colors:**
- Neon green: Bullish capitulation (oversold panic, possible buying opportunity).
- Neon red: Bearish capitulation (overbought euphoria, possible selling opportunity).
- Grey: No significant signal.
- **Registered Signals:** For use in alerts or strategies, the indicator flags each type of event.
**Market Philosophy:**
Capitulation combines *extreme momentum*, *distance from trend*, and *massive volume* to identify potential turning points. This methodology is inspired by historic crash/rebound patterns in stocks and crypto[2][3][4]. Not every signal guarantees a reversal, but clusters of signals often mark good risk/reward entries or exits when panic or euphoria runs high.
**Summary Table:**
| Condition | Triggered When... | Signal | Candle Color |
|------------------|--------------------------------------------------------------|--------------------------|--------------|
| Bullish Capitulation | RSI ≤ oversold, Price ≪ MA, High Volume | Reversal Buy Alert | Neon Green |
| Bearish Capitulation | RSI ≥ overbought, Price ≫ MA, High Volume | Reversal Sell Alert | Neon Red |
| Confirmations | Only RSI + High Volume | Mild Buy/Sell Alert | (internal) |
| None | No conditions met | No Action | Grey |
**Typical Use:**
This indicator is best used with other tools, such as support/resistance or higher timeframe trends, and is adjustable to suit different markets (stocks, crypto, etc.) and trading styles[4][6].
**Limitations:**
- Capitulation signals are only *probabilities*, not certainties—a reversal may require confirmation by price action.
- The default settings may need adjustment for slow/fast-moving assets or different timeframes.
- High volume isn't always panic/euphoria—check fundamentals for context[3][4][5].
Let me know if you want the full logic in pseudo-code or need tips for adjusting parameters to your asset or timeframe.
[1]
[2]
[3]
[4]
[5]![Capitulation Candle for Bitcoin and Crypto V1.0 [ADRIDEM]](https://s3.tradingview.com/8/8ORcHHqk_mid.png)
[6]
[7]![HRC - Hash Rate Capitulation [Da_Prof]](https://s3.tradingview.com/2/2RqnyrRr_mid.png)
[8] in.tradingview.com/scripts/capitulation/
[9] tradingview.com/scripts/volume/
[10] in.tradingview.com/scripts/page-496/?sort=recent&video=yes
**Input Parameters:**
- **RSI Length / Level:** Controls sensitivity to price momentum. Capitulation is flagged when RSI is oversold (e.g., ≤30) or overbought (e.g., ≥70).
- **Moving Average Type / Length:** Lets you choose as baseline (e.g., SMA, EMA) and its lookback period for price deviation calculations.
- **Distance from MA (%):** Sets how far price must stray from the MA (in %) to meet "extreme" conditions.
- **Volume Multiplier / Avg Length:** Requires the current volume to greatly exceed normal (average) volume, confirming broad market participation.
**How the Indicator Works:**
- **Bullish Capitulation:** Triggers when...
- RSI is *very low* (oversold).
- Price is **well below** the chosen MA by the input %, indicating a sharp drop.
- Current volume is **much greater** (e.g., 1.2x or more) than the average, confirming widespread panic selling.
- **Bearish Capitulation:** Triggers when...
- RSI is *very high* (overbought).
- Price is **well above** the MA, indicating a possible buyer frenzy.
- Volume also spikes, confirming conviction in the move.
**Additional Confirmations:**
Isolated checks also register when just the RSI and volume triggers are met, without considering price-MA distance. This helps identify milder extremes for early warning.
**Visual & Signal Output:**
- **Candle Colors:**
- Neon green: Bullish capitulation (oversold panic, possible buying opportunity).
- Neon red: Bearish capitulation (overbought euphoria, possible selling opportunity).
- Grey: No significant signal.
- **Registered Signals:** For use in alerts or strategies, the indicator flags each type of event.
**Market Philosophy:**
Capitulation combines *extreme momentum*, *distance from trend*, and *massive volume* to identify potential turning points. This methodology is inspired by historic crash/rebound patterns in stocks and crypto[2][3][4]. Not every signal guarantees a reversal, but clusters of signals often mark good risk/reward entries or exits when panic or euphoria runs high.
**Summary Table:**
| Condition | Triggered When... | Signal | Candle Color |
|------------------|--------------------------------------------------------------|--------------------------|--------------|
| Bullish Capitulation | RSI ≤ oversold, Price ≪ MA, High Volume | Reversal Buy Alert | Neon Green |
| Bearish Capitulation | RSI ≥ overbought, Price ≫ MA, High Volume | Reversal Sell Alert | Neon Red |
| Confirmations | Only RSI + High Volume | Mild Buy/Sell Alert | (internal) |
| None | No conditions met | No Action | Grey |
**Typical Use:**
This indicator is best used with other tools, such as support/resistance or higher timeframe trends, and is adjustable to suit different markets (stocks, crypto, etc.) and trading styles[4][6].
**Limitations:**
- Capitulation signals are only *probabilities*, not certainties—a reversal may require confirmation by price action.
- The default settings may need adjustment for slow/fast-moving assets or different timeframes.
- High volume isn't always panic/euphoria—check fundamentals for context[3][4][5].
Let me know if you want the full logic in pseudo-code or need tips for adjusting parameters to your asset or timeframe.
[1]
[2]
[3]
[4]
[5]
[6]
[7]
[8] in.tradingview.com/scripts/capitulation/
[9] tradingview.com/scripts/volume/
[10] in.tradingview.com/scripts/page-496/?sort=recent&video=yes
Skrip dilindungi
Skrip ini diterbitkan sebagai sumber tertutup. Akan tetapi, anda boleh menggunakannya secara bebas dan tanpa apa-apa had – ketahui lebih di sini.
Penafian
Maklumat dan penerbitan adalah tidak bertujuan, dan tidak membentuk, nasihat atau cadangan kewangan, pelaburan, dagangan atau jenis lain yang diberikan atau disahkan oleh TradingView. Baca lebih dalam Terma Penggunaan.