PROTECTED SOURCE SCRIPT
Chronos Trend Level Oracle (CTLO)
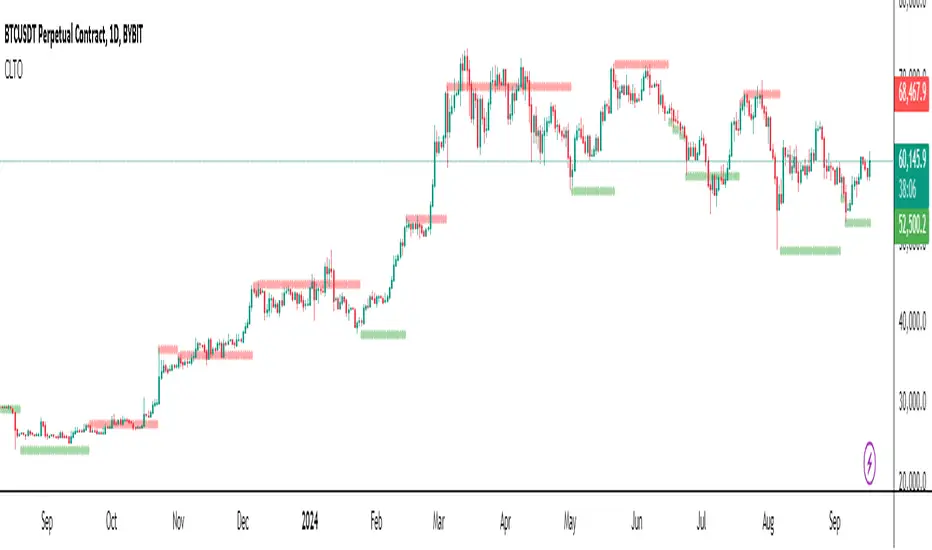
The Chronos Trend Level Oracle (CTLO) is a powerful technical analysis tool designed to identify significant trend levels that can act as support and resistance, helping traders navigate market trends and potential reversal points.
Key Components:
Setup Identification:
CTLO Support Level:
CTLO Resistance Level:
Level Persistence:
Visual Representation:
How to Use the CTLO:
Trend Identification:
Support and Resistance:
Breakouts and Breakdowns:
Trend Continuation:
Reversal Anticipation:
Multiple Timeframe Analysis:
Combine with Price Action:
Risk Management:
Key Components:
Setup Identification:
- Bullish Setup: 9 consecutive closes lower than the close 4 bars earlier.
- Bearish Setup: 9 consecutive closes higher than the close 4 bars earlier.
CTLO Support Level:
- Established when a Bullish Setup completes.
- Represents the lowest low of the CTLO Period (default 9 bars) preceding the Setup completion.
CTLO Resistance Level:
- Established when a Bearish Setup completes.
- Represents the highest high of the CTLO Period (default 9 bars) preceding the Setup completion.
Level Persistence:
- A CTLO level remains active until an opposite Setup completes.
- When a new Setup completes, it clears the opposite level.
Visual Representation:
- Support levels are displayed as green circles.
- Resistance levels are displayed as red circles.
- Both use translucency for better chart visibility.
How to Use the CTLO:
Trend Identification:
- The presence of a CTLO Support level suggests an underlying bullish trend.
- The presence of a CTLO Resistance level suggests an underlying bearish trend.
- The absence of either level indicates a possible trend transition or consolidation.
Support and Resistance:
- Use CTLO levels as potential support (green) or resistance (red) areas.
- These levels often act as price reaction points where bounces or rejections may occur.
Breakouts and Breakdowns:
- A decisive close above a CTLO Resistance level could signal a bullish breakout.
- A decisive close below a CTLO Support level could signal a bearish breakdown.
- Use the optional alerts to be notified of these events.
Trend Continuation:
- Price respecting a CTLO Support level can be seen as bullish, suggesting potential long entries.
- Price respecting a CTLO Resistance level can be seen as bearish, suggesting potential short entries.
Reversal Anticipation:
- As price approaches a CTLO level, watch for signs of reversal (e.g., candlestick patterns, divergences).
- Failed breakouts/breakdowns at CTLO levels can lead to strong moves in the opposite direction.
Multiple Timeframe Analysis:
- Apply CTLO on different timeframes for a more comprehensive market view.
- Higher timeframe CTLO levels often carry more significance.
Combine with Price Action:
- Look for candlestick patterns or chart formations near CTLO levels for higher probability setups.
- Double tops/bottoms or other reversal patterns at CTLO levels can be particularly significant.
Risk Management:
- Use CTLO levels to set stop-loss orders or profit targets.
- For breakout trades, consider using the CTLO level as a new stop-loss after the breakout occurs.
Skrip dilindungi
Skrip ini diterbitkan sebagai sumber tertutup. Akan tetapi, anda boleh menggunakannya secara bebas dan tanpa apa-apa had – ketahui lebih di sini.
Penafian
Maklumat dan penerbitan adalah tidak bertujuan, dan tidak membentuk, nasihat atau cadangan kewangan, pelaburan, dagangan atau jenis lain yang diberikan atau disahkan oleh TradingView. Baca lebih dalam Terma Penggunaan.