Boom Hunter XL
A new and improved Volume Pressure Analysis exclusive to Boom Hunter XL can be turned on or off in the settings. This provides relative volume information highlighting anomalies and key movements. It also shows volume pressure. Sometimes when crossing a support or resistance line it takes a lot of volume to move price just a little. When price action crosses or bounces off a SR line it requires very little volume to move the price a lot. What this means is traders can visually see price action getting pulled in or pushed away from a SR line. The current bar shows live directional pressure. Volume pressure is used to confirm entries and continuations.
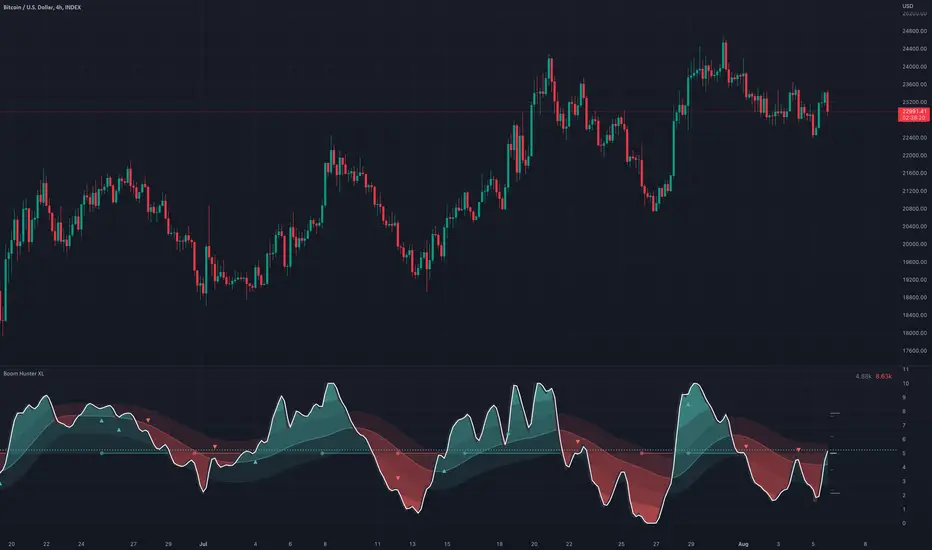
Red wave is the main support resistance line dictating short term trend direction. Enter trades after the oscillator crosses through or even better with pressure dots or volume pressure. If the oscillator is above the red wave it is an up trend and if it is below its a down trend.
The gray wave shows medium term support/resistance and general trend. This line is much harder to cross. Price action can easily bounce within this wave or get rejected.
The strongest SR lines are the top and bottom gray lines. The resistance line will bottom out under pressure and expose a low point. Likewise the support line will roof and expose a high point.
When there is extreme pressure the gray line will drag. This signal suggests that price action will will pullback and retest and push again. Avoid entering trades in these moments as the true bottom/top has not been exposed. Following price action along longer timeframe charts will help find the true low/high.
Tracking traditional patterns makes it easy to find the next breakout and direction.
Bear patterns
Bull patterns
Volume breakouts
Drawing support and resistance lines
Example of some of the signals:
Update also includes alerts:
Crossover: Cross over of the main oscillator
Crossunder: Cross under of the main oscillator
Crossover Red SR: Main Oscillator crosses over the red SR band
Crossunder Red SR: Main Oscillator crosses under the red SR band.
Crossover With Pressure: Main oscillator crosses over while there is pressure (green dots)
Crossunder With Pressure: Main oscillator crosses under while there is pressure (red dots)
Testing Resistance: Bottom support line (oversold) hits the ceiling, signalling price action is testing resistance line of current price channel.
Testing Support: Top resistance line (overbought) bottoms out, signalling price action is testing support line of current price channel.
There are many more alerts and signals to come, I will be releasing them with the release of the boom hunter wiki so I only have to explain it once and can go into detail.
There is now a confirmation for the main oscillator. This uses a second oscillator to give you confirmation of a movement and is very helpful for riding trends. Traders can now change the length of main oscillator and trigger (default setting is 6 and 2 for trigger) and the confirmation oscillator (default 10,2). You can experiment with confirmation oscillator to tune it to the trends you like to ride. For example changing this to something like 20,5 will ride much more longer trends. The indicator price line will be transparent until both these oscillators cross. Which confirmation the price line lights up.
To test this I have included a back testing mode which will be improved in the future. This exposes the color change in the price line as well as all the LSMA volume breakout signals. Next update it will show all the alerts and signals so you can see exactly where they fire.
There is now a light theme mode to improve the look for people using Trading Views light theme. Default color settings have changed for the top and bottom lines which can be changed back by choosing “mono colours” in the settings.
LSMA volume breakouts (circle signal at top of indicator) now only show for the last 10 bars, if you want to see them all use back testing mode. These are solid signals and use LSMA to pickup breakouts in volume which are very hard to notice by eye. A typical volume breakout is a tapering of volume into a large movement. If you use faster timeframes like 15min or less turn off LSMA 6 in settings as it will be too sensitive. Do not just enter trades because you see this signal. This is for when you have already setup a trade and will assist you in a great entry. Entering a trade with a breakout in volume can see you jump straight into profit and makes for a very comfortable entry.
Includes more configurable settings for all of the lines. An an adjusted red SR line (old setting was 27), RVOL can now be hidden.
Below are theme 1 and theme2, both with mono color turned on and volume analysis turned off.
-Added Fibonacci lines with 2 themes: "Scale" and "Sniper"
Some alerts have been removed as they will be handled with new overlay and screener indicators.
Fibonacci lines are now turned on by default.
The switch detector reads volume as a voltage and picks up the mechanical signal of a switch. Instead of looking at the light globe to see when it turns on, this picks up the surge/pattern created when flicking on the switch. This picks up chart movements/cycles directly from the switches used in the ticker machine.. Faster than light.
Adjust "len" in the settings to select the sensitivity of the current used to calculate the threshold. 26 is default but try lengths of 200 or even 6 for smaller surges of current. This script assumes the ticker data is an analog signal and picks up mechanical responses that are embedded within this signal. Nothing is random.
Boom Hunter XL has the most powerful and complete volume analysis tools available to the public.
Purple lines signal cycle changes (can be turned on in settings)
Yellow arrows signal direction of cycle.
Expanded feature is now turned on by default
The amplify feature will amplify the oscillator to assist in riding pump and dumps as well as highlight pullbacks
OSC2 now has the ability to adjust the amount of “pull”
Tooltips are now available in the settings. Hover your cursor over the ⓘ icon in the settings menu for more information on each function.
Skrip jemputan sahaja
Hanya pengguna disahkan oleh penulis boleh mengakses skrip ini. Anda perlu memohon dan mendapatkan kebenaran untuk menggunakannya. Keizinan selalunya diberikan selepas pembayaran. Untuk lebih butiran, ikuti arahan penulis di bawah atau hubungi veryfid secara terus.
TradingView TIDAK menyarankan pembayaran atau penggunaan skrip kecuali anda mempercayai sepenuhnya penulis dan memahami bagaimana ia berfungsi. Anda juga boleh menjumpai alternatif sumber terbuka dan percuma yang lain di dalam skrip komuniti kami.
Arahan penulis
Penafian
Skrip jemputan sahaja
Hanya pengguna disahkan oleh penulis boleh mengakses skrip ini. Anda perlu memohon dan mendapatkan kebenaran untuk menggunakannya. Keizinan selalunya diberikan selepas pembayaran. Untuk lebih butiran, ikuti arahan penulis di bawah atau hubungi veryfid secara terus.
TradingView TIDAK menyarankan pembayaran atau penggunaan skrip kecuali anda mempercayai sepenuhnya penulis dan memahami bagaimana ia berfungsi. Anda juga boleh menjumpai alternatif sumber terbuka dan percuma yang lain di dalam skrip komuniti kami.