OPEN-SOURCE SCRIPT
Telah dikemas kini Ehlers Ultimate Bands (UBANDS)
UBANDS: ULTIMATE BANDS
🔍 OVERVIEW AND PURPOSE
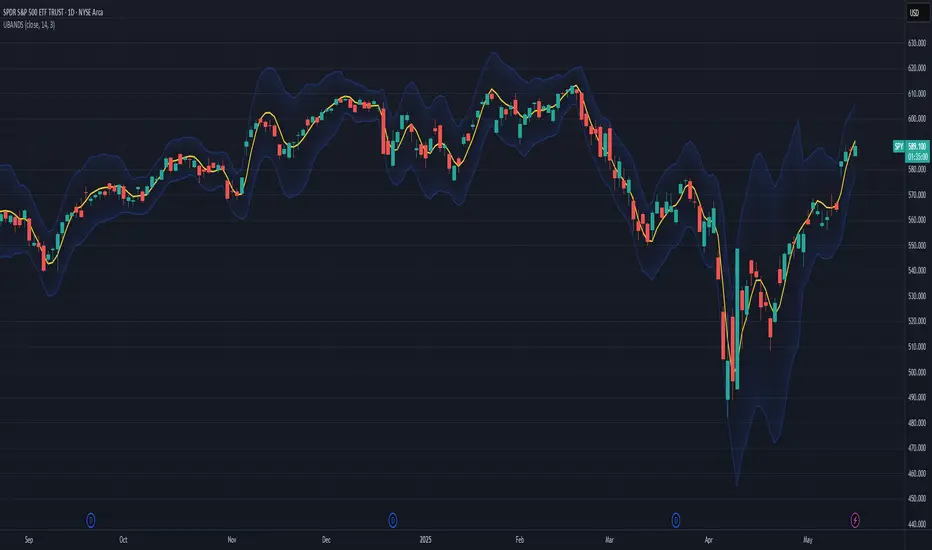
Ultimate Bands, developed by John F. Ehlers, are a volatility-based channel indicator designed to provide a responsive and smooth representation of price boundaries with significantly reduced lag compared to traditional Bollinger Bands. Bollinger Bands typically use a Simple Moving Average for the centerline and standard deviations from it to establish the bands, both of which can increase lag. Ultimate Bands address this by employing Ehlers' Ultrasmooth Filter for the central moving average. The bands are then plotted based on the volatility of price around this ultrasmooth centerline.
The primary purpose of Ultimate Bands is to offer traders a clearer view of potential support and resistance levels that react quickly to price changes while filtering out excessive noise, aiming for nearly zero lag in the indicator band.
🧩 CORE CONCEPTS
🧮 CALCULATION AND MATHEMATICAL FOUNDATION
Ehlers' Original Concept for Deviation:
John Ehlers describes the deviation calculation as: "The deviation at each data sample is the difference between Smooth and the Close at that data point. The Standard Deviation (SD) is computed as the square root of the average of the squares of the individual deviations."
This describes calculating the Root Mean Square (RMS) of the residuals:
Pine Script Implementation's Deviation:
The provided Pine Script implementation calculates the statistical standard deviation of the residuals:
Band Calculation (Common to both approaches, using their respective SD):
📈 INTERPRETATION DETAILS
🛠️ USE AND APPLICATION
Ultimate Bands can be used similarly to how Keltner Channels or Bollinger Bands are used for interpreting price action, with the main difference being the reduced lag.
Example Trading Strategy (from John F. Ehlers):
⚠️ LIMITATIONS AND CONSIDERATIONS
📚 REFERENCES
🔍 OVERVIEW AND PURPOSE
Ultimate Bands, developed by John F. Ehlers, are a volatility-based channel indicator designed to provide a responsive and smooth representation of price boundaries with significantly reduced lag compared to traditional Bollinger Bands. Bollinger Bands typically use a Simple Moving Average for the centerline and standard deviations from it to establish the bands, both of which can increase lag. Ultimate Bands address this by employing Ehlers' Ultrasmooth Filter for the central moving average. The bands are then plotted based on the volatility of price around this ultrasmooth centerline.
The primary purpose of Ultimate Bands is to offer traders a clearer view of potential support and resistance levels that react quickly to price changes while filtering out excessive noise, aiming for nearly zero lag in the indicator band.
🧩 CORE CONCEPTS
- Ultrasmooth Centerline: Employs the Ehlers Ultrasmooth Filter as the basis (centerline) for the bands, aiming for minimal lag and enhanced smoothing.
- Volatility-Adaptive Width: The distance between the upper and lower bands is determined by a measure of price deviation from the ultrasmooth centerline. This causes the bands to widen during volatile periods and contract during calm periods.
- Dynamic Support/Resistance: The bands serve as dynamic levels of potential support (lower band) and resistance (upper band).
🧮 CALCULATION AND MATHEMATICAL FOUNDATION
Ehlers' Original Concept for Deviation:
John Ehlers describes the deviation calculation as: "The deviation at each data sample is the difference between Smooth and the Close at that data point. The Standard Deviation (SD) is computed as the square root of the average of the squares of the individual deviations."
This describes calculating the Root Mean Square (RMS) of the residuals:
- Smooth = UltrasmoothFilter(Source, Length)
- Residuals = Source - Smooth
* SumOfSquaredResiduals = Sum(Residuals^2) for i over Length
* MeanOfSquaredResiduals = SumOfSquaredResiduals / Length
* SD_Ehlers = SquareRoot(MeanOfSquaredResiduals) (This is the RMS of residuals)
Pine Script Implementation's Deviation:
The provided Pine Script implementation calculates the statistical standard deviation of the residuals:
- Smooth = UltrasmoothFilter(Source, Length) (referred to as _ehusf in the script)
- Residuals = Source - Smooth
* Mean_Residuals = Average(Residuals, Length)
* Variance_Residuals = Average((Residuals - Mean_Residuals)^2, Length)
* SD_Pine = SquareRoot(Variance_Residuals) (This is the statistical standard deviation of residuals)
Band Calculation (Common to both approaches, using their respective SD):
- UpperBand = Smooth + (NumSDs × SD)
- LowerBand = Smooth - (NumSDs × SD)
🔍 Technical Note: The Pine Script implementation uses a statistical standard deviation of the residuals (differences between price and the smooth average). Ehlers' original text implies an RMS of these residuals. While both measure dispersion, they will yield slightly different values. The Ultrasmooth Filter itself is a key component, designed for responsiveness.
📈 INTERPRETATION DETAILS
- Reduced Lag: The primary advantage is the significant reduction in lag compared to standard Bollinger Bands, allowing for quicker reaction to price changes.
- Volatility Indication: Widening bands indicate increasing market volatility, while narrowing bands suggest decreasing volatility.
- Overbought/Oversold Conditions (Use with caution):
• Price touching or exceeding the Upper Band may suggest overbought conditions.
• Price touching or falling below the Lower Band may suggest oversold conditions. - Trend Identification:
• Price consistently "walking the band" (moving along the upper or lower band) can indicate a strong trend.
• The Middle Band (Ultrasmooth Filter) acts as a dynamic support/resistance level and indicates the short-term trend direction. - Comparison to Ultimate Channel: Ehlers notes that the Ultimate Band indicator does not differ from the Ultimate Channel indicator in any major fashion.
🛠️ USE AND APPLICATION
Ultimate Bands can be used similarly to how Keltner Channels or Bollinger Bands are used for interpreting price action, with the main difference being the reduced lag.
Example Trading Strategy (from John F. Ehlers):
- Hold a position in the direction of the Ultimate Smoother (the centerline).
- Exit that position when the price "pops" outside the channel or band in the opposite direction of the trade.
- This is described as a trend-following strategy with an automatic following stop.
⚠️ LIMITATIONS AND CONSIDERATIONS
- Lag (Minimized but Present): While significantly reduced, some minimal lag inherent to averaging processes will still exist. Increasing the Length parameter for smoother bands will moderately increase this lag.
- Parameter Sensitivity: The Length and StdDev Multiplier settings are key to tuning the indicator for different assets and timeframes.
- False Signals: As with any band indicator, false signals can occur, particularly in choppy or non-trending markets.
- Not a Standalone System: Best used in conjunction with other forms of analysis for confirmation.
- Deviation Calculation Nuance: Be aware of the difference in deviation calculation (statistical standard deviation vs. RMS of residuals) if comparing directly to Ehlers' original concept as described.
📚 REFERENCES
- Ehlers, J. F. (2024). Article/Publication where "Code Listing 2" for Ultimate Bands is featured. (Specific source to be identified if known, e.g., "Stocks & Commodities Magazine, Vol. XX, No. YY").
- Ehlers, J. F. (General). Various publications on advanced filtering and cycle analysis. (e.g., "Rocket Science for Traders", "Cycle Analytics for Traders").
Nota Keluaran
implemented RMS (Root Mean Square) instead of standard deviation, to make it closer to Ehlers original algorithm of Ultimate BandsSkrip sumber terbuka
Dalam semangat TradingView sebenar, pencipta skrip ini telah menjadikannya sumber terbuka, jadi pedagang boleh menilai dan mengesahkan kefungsiannya. Terima kasih kepada penulis! Walaupuan anda boleh menggunakan secara percuma, ingat bahawa penerbitan semula kod ini tertakluk kepada Peraturan Dalaman.
github.com/mihakralj/pinescript
A collection of mathematically rigorous technical indicators for Pine Script 6, featuring defensible math, optimized implementations, proper state initialization, and O(1) constant time efficiency where possible.
A collection of mathematically rigorous technical indicators for Pine Script 6, featuring defensible math, optimized implementations, proper state initialization, and O(1) constant time efficiency where possible.
Penafian
Maklumat dan penerbitan adalah tidak bertujuan, dan tidak membentuk, nasihat atau cadangan kewangan, pelaburan, dagangan atau jenis lain yang diberikan atau disahkan oleh TradingView. Baca lebih dalam Terma Penggunaan.
Skrip sumber terbuka
Dalam semangat TradingView sebenar, pencipta skrip ini telah menjadikannya sumber terbuka, jadi pedagang boleh menilai dan mengesahkan kefungsiannya. Terima kasih kepada penulis! Walaupuan anda boleh menggunakan secara percuma, ingat bahawa penerbitan semula kod ini tertakluk kepada Peraturan Dalaman.
github.com/mihakralj/pinescript
A collection of mathematically rigorous technical indicators for Pine Script 6, featuring defensible math, optimized implementations, proper state initialization, and O(1) constant time efficiency where possible.
A collection of mathematically rigorous technical indicators for Pine Script 6, featuring defensible math, optimized implementations, proper state initialization, and O(1) constant time efficiency where possible.
Penafian
Maklumat dan penerbitan adalah tidak bertujuan, dan tidak membentuk, nasihat atau cadangan kewangan, pelaburan, dagangan atau jenis lain yang diberikan atau disahkan oleh TradingView. Baca lebih dalam Terma Penggunaan.