PROTECTED SOURCE SCRIPT
Chart Plotter & Scanner Table V1
Script Summary: "Chart Plotter & Scanner Table V1"
This TradingView indicator is designed to give you a comprehensive analysis of the single stock, crypto, or asset currently displayed on your chart. It does this in two main ways:
Visual Signals on the Chart: It draws helpful information directly onto your price chart:
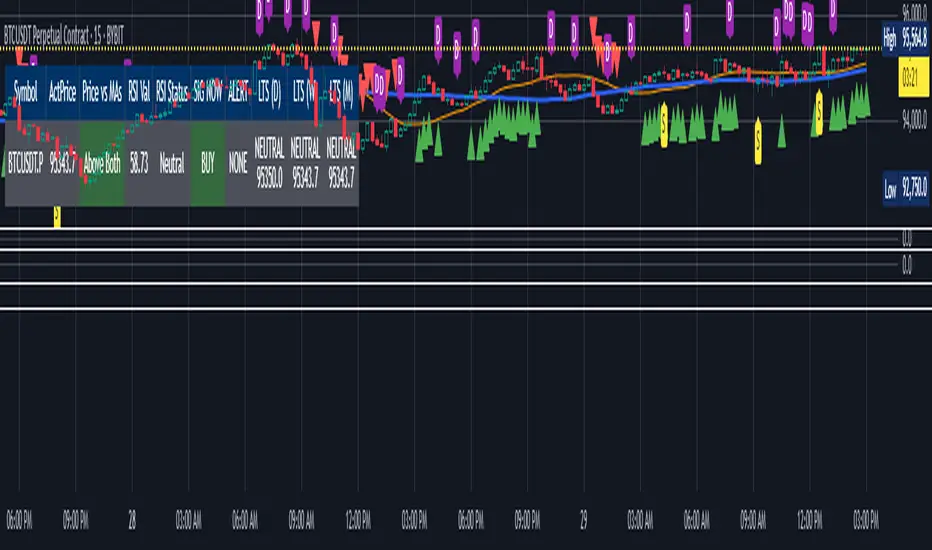
Trend Lines: Plots two moving average lines (one short-term, one long-term) to help you visualize the current price trend.
Buy/Sell Markers ("SIG NOW"): Shows triangle markers below the price (green for potential Buy) or above the price (red for potential Sell) when specific conditions related to price trend and momentum (RSI) are met.
Volume Activity Markers ("ALERT"): Displays small labels ("S" for Spike, "D" for Dump) when the trading volume is unusually high or low compared to its recent average, indicating potentially significant market activity.
Long-Term Signal Markers ("LTS"): Shows small shapes (circles, diamonds, squares) to indicate potential long-term Buy or Sell signals derived from analyzing price action on up to three different, higher timeframes (like Daily, Weekly, Monthly) that you choose.
Status Summary Table: It displays a neat table on your chart (you choose the corner) that acts like a dashboard, summarizing the key findings for the current asset:
Symbol & Price: Shows the ticker symbol and the latest price.
Price vs. Trend: Tells you if the current price is above both trend lines ("Above Both"), below both ("Below Both"), or in between ("Mixed"), with color-coding (Green/Red/Gray).
Momentum (RSI): Shows the current RSI value and its status ("Overbought", "Oversold", or "Neutral"), with color-coding (Red/Green/Gray).
Immediate Signal ("SIG NOW"): Displays the current Buy, Sell, or Neutral status based on the combined trend and momentum rules, with color-coding (Green/Red/Gray).
Volume Alert ("ALERT"): Shows if there's a volume Spike, Dump, or None, with color-coding (Orange/Purple/Gray).
Long-Term Signals (LTS): Shows the Buy, Sell, or Neutral status calculated from each of the three chosen higher timeframes, including the price at which the signal occurred on that timeframe, with color-coding (Green/Red/Gray).
Essentially, this script combines short-term trend and momentum analysis with volume activity monitoring and longer-term perspective signals, presenting the information clearly on your chart and in a summary table for quick assessment. It also allows you to create TradingView alerts based on these signals.
How to Adjust the Script Settings
You can customize how this script works through its "Settings" panel in TradingView. Here’s a breakdown of each section:
1. Indicator Settings (Chart Timeframe)
These settings control the main calculations done on your current chart's timeframe.
MA Source: Choose which price point (Close, Open, High, Low, etc.) the moving averages should be based on. (Default: Close)
Short MA Period: Set the number of bars for the shorter-term moving average. A smaller number makes it react faster to price changes. (Default: 20)
Long MA Period: Set the number of bars for the longer-term moving average. A larger number shows a smoother, longer-term trend. (Default: 50)
RSI Source: Choose which price point the RSI momentum calculation should use. (Default: Close)
RSI Period: Set the number of bars for the RSI calculation. (Default: 14)
RSI Overbought Level: The RSI level above which the asset is considered potentially "Overbought". (Default: 70)
RSI Oversold Level: The RSI level below which the asset is considered potentially "Oversold". (Default: 30)
SIG NOW RSI Buy Min: The minimum RSI value required (along with price being above MAs) to trigger a "SIG NOW" Buy signal. (Default: 55)
SIG NOW RSI Sell Max: The maximum RSI value required (along with price being below MAs) to trigger a "SIG NOW" Sell signal. (Default: 45)
Volume Lookback (LBV): How many bars to look back to calculate the average volume for the Spike/Dump alerts. (Default: 3)
Volume MA Type: The type of averaging method used for the volume calculation (EMA is generally preferred for responsiveness). (Default: EMA)
2. Volume Alert Settings
These control how sensitive the Volume Spike/Dump alerts are.
Volume Alert Sensitivity: Choose a preset sensitivity level:
"Normal": Standard thresholds for spike/dump detection.
"Sensitive": Requires less deviation from the average volume to trigger an alert.
"Highly Sensitive": Triggers alerts on even smaller volume deviations.
"Custom": Ignores the presets and uses the manual multipliers below.
Custom Spike Multiplier (>1): (Only used if Sensitivity is "Custom") How many times greater than the average volume the current volume must be to trigger a SPIKE. (e.g., 1.5 means 50% higher).
Custom Dump Multiplier (<1): (Only used if Sensitivity is "Custom") How many times smaller than the average volume the current volume must be to trigger a DUMP. (e.g., 0.7 means 30% lower).
3. Long Term Signal (LTS) Settings
These settings control the calculations for the three independent Long-Term Signals, which look at higher timeframes.
LTS Timeframe 1/2/3: Select the higher timeframes (e.g., 'D' for Daily, 'W' for Weekly, 'M' for Monthly) for each of the three LTS calculations.
LTS BB Source: The price source used for the Bollinger Band calculation on the LTS timeframes. (Default: Close)
LTS BB Length: The period (number of bars on the LTS timeframe) used for the Bollinger Band calculation. (Default: 20)
LTS BB StdDev: The standard deviation multiplier for the Bollinger Bands used in the LTS calculation. (Default: 2.0)
4. Plotting Settings
These control what is visually displayed on the price chart itself.
Plot MAs?: Checkbox to show or hide the two moving average lines.
Plot SIG NOW Markers?: Checkbox to show or hide the green/red triangle Buy/Sell markers.
Plot ALERT Markers?: Checkbox to show or hide the "S" / "D" volume Spike/Dump labels.
Plot LTS Markers?: Checkbox to show or hide the long-term signal markers (circles, diamonds, squares).
Plot LTS Markers For: Dropdown to choose whether to show markers for only LTS TF1, TF2, TF3, or "All" of them.
5. Table Settings
These control the appearance and content of the summary table.
Show Status Table?: Checkbox to show or hide the entire summary table.
Table Position: Choose which corner or side of the chart the table should appear on.
Decimal Places (Non-Price): How many decimal places to show for values like the RSI number in the table.
Table Text Size: Adjust the font size inside the table cells.
Setting Up Alerts:
This script creates the conditions for alerts. To actually receive notifications:
Click the "Alert" button (clock icon) in TradingView's top toolbar or right-click on the chart.
In the "Condition" dropdown, select the script name ("Chart Plotter & Scanner Table V1").
You will see a list of available alert conditions created by the script (e.g., "SIG NOW Buy Alert", "RSI Overbought Alert", "LTS TF1 Buy Alert", etc.). Choose the one you want.
Configure the rest of the alert settings (Options, Actions, Message) as desired.
Click "Create". Repeat for any other signals you want alerts for.
By adjusting these settings, you can fine-tune the indicator to match your trading style, the specific asset you are analyzing, and the timeframes you are interested in.
This TradingView indicator is designed to give you a comprehensive analysis of the single stock, crypto, or asset currently displayed on your chart. It does this in two main ways:
Visual Signals on the Chart: It draws helpful information directly onto your price chart:
Trend Lines: Plots two moving average lines (one short-term, one long-term) to help you visualize the current price trend.
Buy/Sell Markers ("SIG NOW"): Shows triangle markers below the price (green for potential Buy) or above the price (red for potential Sell) when specific conditions related to price trend and momentum (RSI) are met.
Volume Activity Markers ("ALERT"): Displays small labels ("S" for Spike, "D" for Dump) when the trading volume is unusually high or low compared to its recent average, indicating potentially significant market activity.
Long-Term Signal Markers ("LTS"): Shows small shapes (circles, diamonds, squares) to indicate potential long-term Buy or Sell signals derived from analyzing price action on up to three different, higher timeframes (like Daily, Weekly, Monthly) that you choose.
Status Summary Table: It displays a neat table on your chart (you choose the corner) that acts like a dashboard, summarizing the key findings for the current asset:
Symbol & Price: Shows the ticker symbol and the latest price.
Price vs. Trend: Tells you if the current price is above both trend lines ("Above Both"), below both ("Below Both"), or in between ("Mixed"), with color-coding (Green/Red/Gray).
Momentum (RSI): Shows the current RSI value and its status ("Overbought", "Oversold", or "Neutral"), with color-coding (Red/Green/Gray).
Immediate Signal ("SIG NOW"): Displays the current Buy, Sell, or Neutral status based on the combined trend and momentum rules, with color-coding (Green/Red/Gray).
Volume Alert ("ALERT"): Shows if there's a volume Spike, Dump, or None, with color-coding (Orange/Purple/Gray).
Long-Term Signals (LTS): Shows the Buy, Sell, or Neutral status calculated from each of the three chosen higher timeframes, including the price at which the signal occurred on that timeframe, with color-coding (Green/Red/Gray).
Essentially, this script combines short-term trend and momentum analysis with volume activity monitoring and longer-term perspective signals, presenting the information clearly on your chart and in a summary table for quick assessment. It also allows you to create TradingView alerts based on these signals.
How to Adjust the Script Settings
You can customize how this script works through its "Settings" panel in TradingView. Here’s a breakdown of each section:
1. Indicator Settings (Chart Timeframe)
These settings control the main calculations done on your current chart's timeframe.
MA Source: Choose which price point (Close, Open, High, Low, etc.) the moving averages should be based on. (Default: Close)
Short MA Period: Set the number of bars for the shorter-term moving average. A smaller number makes it react faster to price changes. (Default: 20)
Long MA Period: Set the number of bars for the longer-term moving average. A larger number shows a smoother, longer-term trend. (Default: 50)
RSI Source: Choose which price point the RSI momentum calculation should use. (Default: Close)
RSI Period: Set the number of bars for the RSI calculation. (Default: 14)
RSI Overbought Level: The RSI level above which the asset is considered potentially "Overbought". (Default: 70)
RSI Oversold Level: The RSI level below which the asset is considered potentially "Oversold". (Default: 30)
SIG NOW RSI Buy Min: The minimum RSI value required (along with price being above MAs) to trigger a "SIG NOW" Buy signal. (Default: 55)
SIG NOW RSI Sell Max: The maximum RSI value required (along with price being below MAs) to trigger a "SIG NOW" Sell signal. (Default: 45)
Volume Lookback (LBV): How many bars to look back to calculate the average volume for the Spike/Dump alerts. (Default: 3)
Volume MA Type: The type of averaging method used for the volume calculation (EMA is generally preferred for responsiveness). (Default: EMA)
2. Volume Alert Settings
These control how sensitive the Volume Spike/Dump alerts are.
Volume Alert Sensitivity: Choose a preset sensitivity level:
"Normal": Standard thresholds for spike/dump detection.
"Sensitive": Requires less deviation from the average volume to trigger an alert.
"Highly Sensitive": Triggers alerts on even smaller volume deviations.
"Custom": Ignores the presets and uses the manual multipliers below.
Custom Spike Multiplier (>1): (Only used if Sensitivity is "Custom") How many times greater than the average volume the current volume must be to trigger a SPIKE. (e.g., 1.5 means 50% higher).
Custom Dump Multiplier (<1): (Only used if Sensitivity is "Custom") How many times smaller than the average volume the current volume must be to trigger a DUMP. (e.g., 0.7 means 30% lower).
3. Long Term Signal (LTS) Settings
These settings control the calculations for the three independent Long-Term Signals, which look at higher timeframes.
LTS Timeframe 1/2/3: Select the higher timeframes (e.g., 'D' for Daily, 'W' for Weekly, 'M' for Monthly) for each of the three LTS calculations.
LTS BB Source: The price source used for the Bollinger Band calculation on the LTS timeframes. (Default: Close)
LTS BB Length: The period (number of bars on the LTS timeframe) used for the Bollinger Band calculation. (Default: 20)
LTS BB StdDev: The standard deviation multiplier for the Bollinger Bands used in the LTS calculation. (Default: 2.0)
4. Plotting Settings
These control what is visually displayed on the price chart itself.
Plot MAs?: Checkbox to show or hide the two moving average lines.
Plot SIG NOW Markers?: Checkbox to show or hide the green/red triangle Buy/Sell markers.
Plot ALERT Markers?: Checkbox to show or hide the "S" / "D" volume Spike/Dump labels.
Plot LTS Markers?: Checkbox to show or hide the long-term signal markers (circles, diamonds, squares).
Plot LTS Markers For: Dropdown to choose whether to show markers for only LTS TF1, TF2, TF3, or "All" of them.
5. Table Settings
These control the appearance and content of the summary table.
Show Status Table?: Checkbox to show or hide the entire summary table.
Table Position: Choose which corner or side of the chart the table should appear on.
Decimal Places (Non-Price): How many decimal places to show for values like the RSI number in the table.
Table Text Size: Adjust the font size inside the table cells.
Setting Up Alerts:
This script creates the conditions for alerts. To actually receive notifications:
Click the "Alert" button (clock icon) in TradingView's top toolbar or right-click on the chart.
In the "Condition" dropdown, select the script name ("Chart Plotter & Scanner Table V1").
You will see a list of available alert conditions created by the script (e.g., "SIG NOW Buy Alert", "RSI Overbought Alert", "LTS TF1 Buy Alert", etc.). Choose the one you want.
Configure the rest of the alert settings (Options, Actions, Message) as desired.
Click "Create". Repeat for any other signals you want alerts for.
By adjusting these settings, you can fine-tune the indicator to match your trading style, the specific asset you are analyzing, and the timeframes you are interested in.
Skrip dilindungi
Skrip ini diterbitkan sebagai sumber tertutup. Akan tetapi, anda boleh menggunakannya secara bebas dan tanpa apa-apa had – ketahui lebih di sini.
Penafian
Maklumat dan penerbitan adalah tidak bertujuan, dan tidak membentuk, nasihat atau cadangan kewangan, pelaburan, dagangan atau jenis lain yang diberikan atau disahkan oleh TradingView. Baca lebih dalam Terma Penggunaan.