OPEN-SOURCE SCRIPT
Consecutive count backtester / quantifytools
- Overview
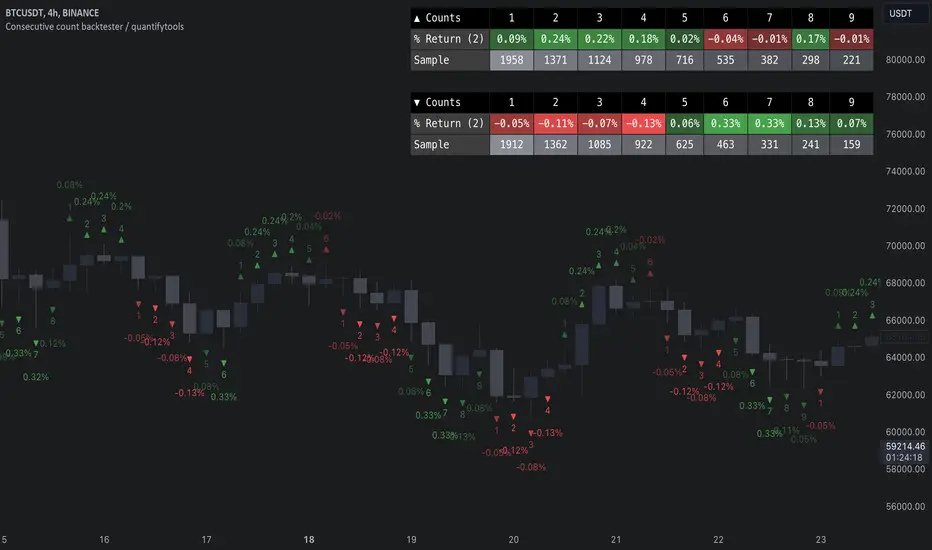
Consecutive counting is a simple method to mechanically define trending states to the upside and downside. Consecutive counts are calculated by taking reference price level (e.g. close 4 candles ago) and count closes above/below it up to a maximum count that resets the consecutive count back to 1. This tool provides the means to backtest each count by measuring % change in price after each count (e.g. % gain 2 candles after a given count).

Users can define reference source that starts the consecutive count (e.g. close 4 candles ago), maximum count where counter resets (e.g. after 9th count) and backtesting period (e.g. price change 2 candles after count).

Filters add extra conditions that must be met on the consecutive count to qualify as valid, which are also reflected on the backtest metrics. The counts can be refined using the following filters:
- RSI above/below X
- Price above/below/at moving average of choice
- Relative volume above/below X

Average gain corresponding to each count as they occur can be toggled off for less clutter. Average price change can also be visualized using candle color. Colors, gradient and table/label sizes are fully customizable.

- Practical guide
Example #1: Identify reversal potential
Consecutive counting is a simple yet effective method to for detecting reversals, for which 7-9 counts are traditionally used. Whether that holds true or not can now be put through a test with different variations of the method as well as using additional filters to improve the probability of a turn.


Example #2: Identify trend following potential
Consecutive counts can also have utility value for trend following. When historical short term change is to the downside, expect downside, when to the upside, expect upside.

Consecutive counting is a simple method to mechanically define trending states to the upside and downside. Consecutive counts are calculated by taking reference price level (e.g. close 4 candles ago) and count closes above/below it up to a maximum count that resets the consecutive count back to 1. This tool provides the means to backtest each count by measuring % change in price after each count (e.g. % gain 2 candles after a given count).
Users can define reference source that starts the consecutive count (e.g. close 4 candles ago), maximum count where counter resets (e.g. after 9th count) and backtesting period (e.g. price change 2 candles after count).
Filters add extra conditions that must be met on the consecutive count to qualify as valid, which are also reflected on the backtest metrics. The counts can be refined using the following filters:
- RSI above/below X
- Price above/below/at moving average of choice
- Relative volume above/below X
Average gain corresponding to each count as they occur can be toggled off for less clutter. Average price change can also be visualized using candle color. Colors, gradient and table/label sizes are fully customizable.
- Practical guide
Example #1: Identify reversal potential
Consecutive counting is a simple yet effective method to for detecting reversals, for which 7-9 counts are traditionally used. Whether that holds true or not can now be put through a test with different variations of the method as well as using additional filters to improve the probability of a turn.
Example #2: Identify trend following potential
Consecutive counts can also have utility value for trend following. When historical short term change is to the downside, expect downside, when to the upside, expect upside.
Skrip sumber terbuka
Dalam semangat TradingView sebenar, pencipta skrip ini telah menjadikannya sumber terbuka, jadi pedagang boleh menilai dan mengesahkan kefungsiannya. Terima kasih kepada penulis! Walaupuan anda boleh menggunakan secara percuma, ingat bahawa penerbitan semula kod ini tertakluk kepada Peraturan Dalaman.
See through charts with orderflow.
Spot rekt traders and whales, liquidity pools, unusual volume & backtest it.
Try risk free for 30 days.
Get FlowMap:
flowly.tools
Spot rekt traders and whales, liquidity pools, unusual volume & backtest it.
Try risk free for 30 days.
Get FlowMap:
flowly.tools
Penafian
Maklumat dan penerbitan adalah tidak bertujuan, dan tidak membentuk, nasihat atau cadangan kewangan, pelaburan, dagangan atau jenis lain yang diberikan atau disahkan oleh TradingView. Baca lebih dalam Terma Penggunaan.