Candles Preview MTF
The script displays a mini-chart with candlesticks from different symbols and timeframes (up to 8 in total). It can display up to 24 candles. You can use it on any timeframe, but it is intended to work with the same or higher timeframes than the chart's. For example: you can add a mini-chart displaying candles of the chart's symbol from Weekly timeframe, while being on Daily timeframe. The script updates in realtime, but it is not recommended to use it on very low timeframes (1 second for example).
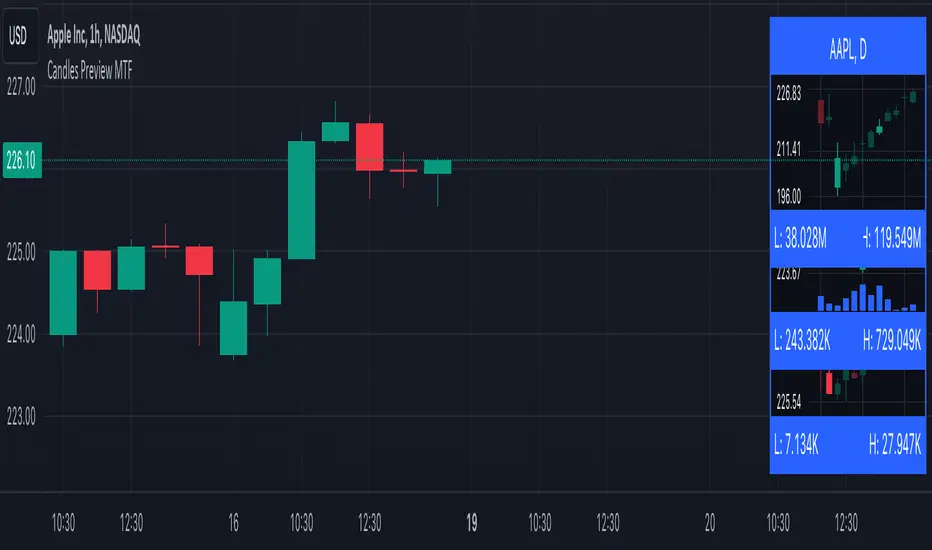
Below you can find some examples of using the indicator:
https://www.tradingview.com/x/2XKBLERi/
(custom colors, highest and lowest volume in footer, symbol name with exchange in header)
(a chart with Weekly and a chart with Monthly candles, custom colors, no footer, timeframe in header)
(charts for 5 different stocks, no footer, symbol name in header)
Along with the chart it displays a header with Symbol and Timeframe, as well as footer with highest and lowest Price or Volume for selected number of candles. Each candle displays a tooltip with the following information when hovered:
- Date / Time
- Open, High, Low and Close prices
- Price change (absolute and %)
- Volume
- Volume change (absolute and %)
By default the interface changes colors if you switch to / from "Dark mode", but you can also manually customise any colors to your likings. You can also hide both header and footer, customise what information is displayed in them, show / hide the chart's grid and change its "density", choose position and height for each of the 8 charts. Additionally, you can change the timezone used to calculate time and date.
Inputs:
The indicator's inputs are separated into groups:
- Other (contains the "Timezone" parameter)
- Chart 1 (contains parameters specific for each chart)
- Chart 2
- Chart N
- ...
- Charts (contains parameters that modify all the 8 charts)
- Colors (contains parameters for styling)
How to get it:
Contact me on Tradingview using private chat, and I will grant you a 3 day trial access
On a side note:
You can share your feedback or ideas in the comments, it will help me improve the indicator. Refer to "Release notes" section for any future updates. Thank you!
17 Aug 2024:
- added support for lower timeframes (including second-based)
- number of charts lowered to 3
- added price scale
- added volume chart
- candle highlighting based on Lowest / Highest price, volume, Rising / Falling volume
- added options to customise candle size, spacing, etc.
Skrip jemputan sahaja
Hanya pengguna yang diluluskan oleh penulis boleh mengakses skrip ini. Anda perlu memohon dan mendapatkan kebenaran untuk menggunakannya. Ini selalunya diberikan selepas pembayaran. Untuk lebih butiran, ikuti arahan penulis di bawah atau hubungi terus sabricat.
TradingView tidak menyarankan pembayaran untuk atau menggunakan skrip kecuali anda benar-benar mempercayai penulisnya dan memahami bagaimana ia berfungsi. Anda juga boleh mendapatkan alternatif sumber terbuka lain yang percuma dalam skrip komuniti kami.
Arahan penulis
Amaran: sila baca panduan kami untuk skrip jemputan sahaja sebelum memohon akses.
Penafian
Skrip jemputan sahaja
Hanya pengguna yang diluluskan oleh penulis boleh mengakses skrip ini. Anda perlu memohon dan mendapatkan kebenaran untuk menggunakannya. Ini selalunya diberikan selepas pembayaran. Untuk lebih butiran, ikuti arahan penulis di bawah atau hubungi terus sabricat.
TradingView tidak menyarankan pembayaran untuk atau menggunakan skrip kecuali anda benar-benar mempercayai penulisnya dan memahami bagaimana ia berfungsi. Anda juga boleh mendapatkan alternatif sumber terbuka lain yang percuma dalam skrip komuniti kami.
Arahan penulis
Amaran: sila baca panduan kami untuk skrip jemputan sahaja sebelum memohon akses.