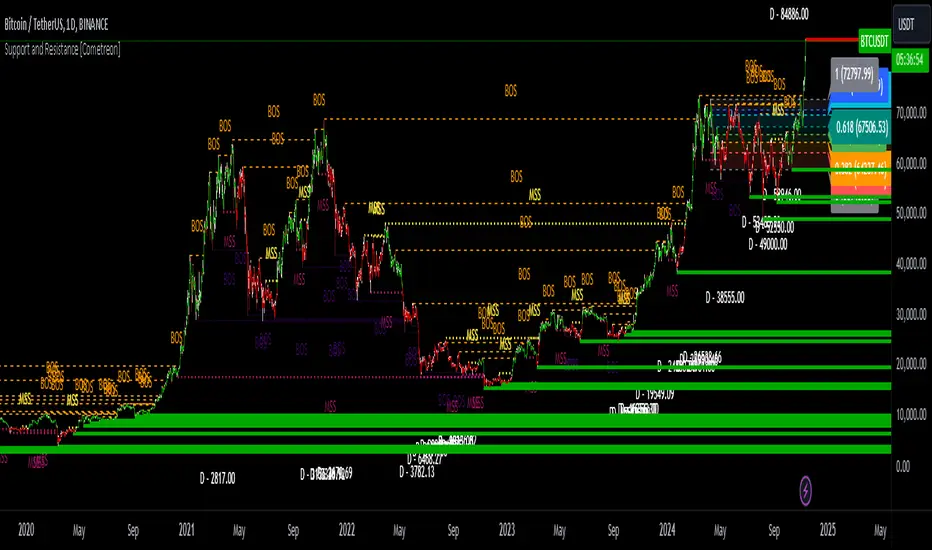
Support and Resistance MTF [Cometreon]
If you're looking for a smart, dynamic, and highly customizable S&R solution, this is the tool for you.
🔷 Key Features & Improvements
🟩 Automatic Level Detection
The indicator automatically plots all support and resistance levels, providing a clear map of key points on the chart.
🟩 Historical Level Display
Shows historical support and resistance levels, providing a comprehensive view of the market over time.
🟩 Dynamic Trend Creation
Automatically identifies and updates trends based on levels, simplifying the understanding of market directions.
🟩 Automatic Fibonacci
Generates Fibonacci levels based on the last two support and resistance levels, offering additional reference points for potential price retracements or extensions.
🟩 Customizable Alerts
Offers a series of configurable alerts to keep you informed about breakouts, new confirmed levels, and price bounces on active levels.
🔷 Technical Details and Customizable Inputs
1️⃣ Line Types - Select the type of lines to display: active, broken, both, or none.
2️⃣ Left Length - Determines the number of candles to calculate the previous high or low point.
3️⃣ Right Length - Defines the number of candles needed to confirm a level as Support or Resistance.
4️⃣ Timeframe - You can modify the timeframe of supports and resistances to view levels of a higher timeframe. It's also possible to add additional support and resistance levels using a second timeframe.
5️⃣ Breakout Source - Change the source needed to break support and resistance levels between Close or High/Low.
6️⃣ Delete at Timeframe - Allows removing levels based on the current chart resource instead of using that of the higher timeframe.
7️⃣ Session Range - Choose a period of distance from the last candle to define how far back in the past the indicator should look for Supports or Resistances.
8️⃣ Style Valid Level - Customize the appearance of active levels, including the color of the level itself, Liquidity fill, text color, line style and thickness, extension, as well as the size, position, and values to display in the level text.
9️⃣ Liquidity - This option displays the liquidity associated with each support and resistance level, with three modes: "Wick" which goes from the high/low to the upper/lower body, "Body" instead goes from the level to the lower/upper body of the candle and "Full Range" which extends from the high to the low of the candle.
1️⃣0️⃣ Style Break Level - Allows modifying color, style, and thickness of lines, as well as text width, for two types of breakouts: "MSS" and "BOS".
- "MSS" stands for "Market Structure Switch" and indicates a level breakout opposite to the previous breakout, signaling a trend reversal.
- "BOS", on the other hand, means "Break of Structure" and occurs when a level is broken in the same direction as the previous one, confirming trend continuation.
1️⃣1️⃣ Fibonacci Trend Line - Add up to 8 Fibonacci levels based on the last two identified support and resistance levels. Customize the different levels by modifying colors, thickness, style, and extension of lines. You also have the option to add a transparent background between each level.
1️⃣2️⃣ Use Only Confirmed Levels - Activate this option if you want the system to use only the last two confirmed levels, excluding potential levels not yet confirmed.
1️⃣3️⃣ Reverse - Used to reverse the direction of Fibonacci lines.
1️⃣4️⃣ Use Higher / Lower - This option allows using the currently active maximum and minimum levels of Support and Resistance. The indicator will update each Support level until it encounters another active Resistance, and vice versa.
1️⃣5️⃣ Trend Style - Activate/deactivate two types of indicator Trends: "Bar Color" based on level breakouts and "Background Color" based on the last active unconfirmed level.
1️⃣6️⃣ Signal Style - Activate or deactivate the various breakout and bounce signals. Bounces present three options:
- Total Rejection(TR): occurs when the price exceeds the high or low and closes below the liquidity level.
- Internal Rejection(IR): the price closes in the liquidity zone.
- Liquidity Rejection(LR): the price does not exceed the high or low, but only the liquidity level, closing below it.
1️⃣7️⃣ Customized Alerts - Set alerts to be notified in case of breakouts, bounces, or formation of new levels.
These options allow you to optimize the indicator for different trading styles and market conditions, ensuring accurate and tailored technical analysis.
🔍 How to Use Support and Resistance MTF Pro
📌 Using Critical Levels
Consider all levels on the chart as "magnetic points" for the price. These represent critical areas where the market tends to react.
📈 Signal Interpretation
Use the indicator's signals to interpret market movements. A level breakout can indicate a trend reversal or continuation. Bounces can suggest the holding of a level or signal a possible breakout.
🛠 Strategy Integration
Leverage the trend of support and resistance levels, breakouts, and bounces as key elements to develop and refine your trading strategies.
☄️ Support and Resistance simplifies your market analysis, saving you time and improving the accuracy of your decisions. Thanks to clearly visualized and customizable levels, you'll have a clearer and more immediate view of market dynamics.
Don't wait any longer: discover how Support and Resistance can enhance your market analysis, offering you clear indications for faster and more precise trading decisions.
Skrip jemputan sahaja
Hanya pengguna disahkan oleh penulis boleh mengakses skrip ini. Anda perlu memohon dan mendapatkan kebenaran untuk menggunakannya. Keizinan selalunya diberikan selepas pembayaran. Untuk lebih butiran, ikuti arahan penulis di bawah atau hubungi Cometreon secara terus.
TradingView TIDAK menyarankan pembayaran atau penggunaan skrip kecuali anda mempercayai sepenuhnya penulis dan memahami bagaimana ia berfungsi. Anda juga boleh menjumpai alternatif sumber terbuka dan percuma yang lain di dalam skrip komuniti kami.
Arahan penulis
Penafian
Skrip jemputan sahaja
Hanya pengguna disahkan oleh penulis boleh mengakses skrip ini. Anda perlu memohon dan mendapatkan kebenaran untuk menggunakannya. Keizinan selalunya diberikan selepas pembayaran. Untuk lebih butiran, ikuti arahan penulis di bawah atau hubungi Cometreon secara terus.
TradingView TIDAK menyarankan pembayaran atau penggunaan skrip kecuali anda mempercayai sepenuhnya penulis dan memahami bagaimana ia berfungsi. Anda juga boleh menjumpai alternatif sumber terbuka dan percuma yang lain di dalam skrip komuniti kami.