Three-Session Volume ProfileOverview
Three-Session Volume Profile divides intraday trading into three independently configurable sessions: Asia, London, and New York. Instead of combining the entire trading day into one profile, the indicator resets its calculations at the beginning of each session and displays a separate Volume Profile, Point of Control, Value Area, VWAP, and optional deviation bands for each period.
This structure is intended for traders who analyze how price and volume distribution change as market participation moves between global trading sessions. Each session is treated as its own auction, making it possible to compare where volume was accepted during one session with how price behaves during the next.
The default schedules use the America/New_York time zone:
Asia: 18:00โ03:00
London: 03:00โ09:30
New York: 09:30โ16:00
All schedules and the time zone are configurable. The America/New_York setting automatically accounts for daylight-saving changes.
Why the components are combined
The Volume Profile, session VWAP, and deviation bands are not calculated as unrelated indicators. They all use the same independently resetting session windows.
The Volume Profile describes how the sessionโs volume was distributed across price. VWAP provides the sessionโs volume-weighted mean price, while the deviation bands describe dispersion around that mean. Together, they provide two complementary views of the same session:
Volume Profile identifies price areas with relatively high or low participation.
POC identifies the profile row containing the most allocated volume.
VAH and VAL define the boundaries of the selected value area.
VWAP represents the sessionโs volume-weighted average price.
Deviation bands provide context for how far price is trading from the sessionโs weighted mean.
The purpose of this combination is to provide a consistent session-based framework rather than merge unrelated studies.
Volume Profile calculation
For each active session, the indicator tracks the session high, low, and volume. The complete session range is divided into a configurable number of equally sized price rows.
Because standard chart data does not provide the exact price of every transaction, each chart barโs volume is allocated across the profile rows intersected by that barโs high-low range. The allocation is proportional to the amount of the barโs range overlapping each row. A bar with no measurable range has its volume assigned to the row containing its representative price.
The profile is recalculated when the sessionโs price range expands. This keeps the rows distributed across the complete developing session range.
The Rows setting controls profile resolution and supports values from 12 to 200. More rows provide finer price segmentation but also increase calculation requirements. The profile is based on chart bars rather than tick-by-tick or lower-timeframe transaction data, so changing the chart timeframe can change the resulting distribution.
POC and Value Area calculation
The Point of Control , or POC, is the midpoint of the profile row containing the greatest allocated volume.
The Value Area begins at the POC row. The calculation then compares the next available row above and below the current Value Area and adds the side containing more volume. This process continues until the selected percentage of total session volume has been included.
The resulting levels are:
VAH: Upper boundary of the Value Area
VAL: Lower boundary of the Value Area
POC: Midpoint of the highest-volume profile row
The default Value Area contains 70% of session volume, but this percentage can be adjusted.
Developing and completed levels
While a session is active, the developing VAH , VAL , and POC can be displayed. These levels update as new price and volume information enters the session.
When the session ends, the final profile and levels are stored as completed session values. The number of completed profiles retained for each session can be controlled from the settings.
Developing values are expected to move. A new session high or low changes the profile range and can cause all rows to be redistributed. Completed levels remain fixed unless the chart data, timeframe, symbol, session schedule, or indicator settings are changed.
Session VWAP and deviation bands
The optional VWAP calculation resets independently at the beginning of each session. It uses HLC3 as the representative bar price and weights it by volume.
The session VWAP is calculated as:
Volume-weighted price sum รท Session volume sum
The standard deviation calculation is also volume-weighted. The selected multiplier is applied above and below VWAP to produce the upper and lower bands.
These bands are descriptive measurements of session dispersion. They are not automatic overbought or oversold signals.
Profile placement
Each profile can be positioned on either side of its own session:
Left: Anchors the profile to the session opening edge and extends it to the right.
Right: Anchors the profile to the session closing or current edge and extends it to the left.
This setting refers to the boundaries of each session, not the far-left or far-right edge of the visible chart.
The Maximum width setting controls the profileโs horizontal display width in chart bars. It changes only the visual width and does not affect the underlying volume calculations.
How to use the indicator
1. Configure the time zone
Select the time zone used to interpret all three schedules. America/New_York is suitable when session times should follow Eastern Time and adjust automatically for daylight saving.
Use a fixed UTC offset only when daylight-saving adjustment is not desired.
2. Configure the sessions
Set the opening and closing time for Asia, London, and New York. Overnight schedules, such as 18:00โ03:00, are supported.
The sessions may overlap if desired. When they overlap, each session continues to calculate independently.
3. Select profile resolution
Increase the number of rows for more detailed price segmentation. Lower values produce broader profile levels and require fewer calculations.
Profile precision also depends on the chart timeframe. Lower chart timeframes generally provide more granular source bars, while higher timeframes provide a broader approximation.
4. Select the Value Area percentage
The standard default is 70%. Increasing the percentage produces a wider Value Area, while reducing it produces a narrower area around the POC.
5. Choose completed or developing levels
Developing levels can be used to observe how the current sessionโs distribution changes. Completed levels provide fixed references from prior sessions.
Traders may examine whether price:
Accepts or rejects a previous sessionโs Value Area
Rotates around a prior POC
Moves from one sessionโs value region toward another
Holds above or below a prior VAH or VAL
Trades near or away from the active session VWAP
These are contextual observations rather than predefined entry or exit signals.
6. Enable VWAP and deviation bands if needed
VWAP can provide a session-weighted reference price alongside the distribution-based profile. Deviation bands can be enabled to visualize dispersion around that reference.
Interpretation
A wide section of the profile represents a row receiving relatively more allocated volume. A narrow section represents relatively less allocated volume.
POC and Value Area levels identify areas of historical participation, but they do not guarantee future support or resistance. Their interpretation depends on market structure, volatility, liquidity, instrument type, and the traderโs broader methodology.
On centralized futures markets, the script uses the exchange-reported volume available on the chart. On markets where only tick volume is available, the profile reflects that data instead of centralized transaction volume.
Recalculation and limitations
The indicator does not request future data or use lookahead calculations. Completed sessions are based only on bars belonging to those sessions.
Developing profiles and levels update during the active bar as its high, low, and volume change. This is normal real-time recalculation and should not be interpreted as a fixed signal.
The profile is an approximation created from chart-bar ranges and volume. It is not a tick-level bid/ask profile, footprint chart, or reconstruction of individual transactions. Results can differ from volume-profile tools that use lower-timeframe or transaction-level data.
This indicator is an analytical tool and does not provide trade entries, exits, profit projections, or guarantees of future performance. Penunjuk

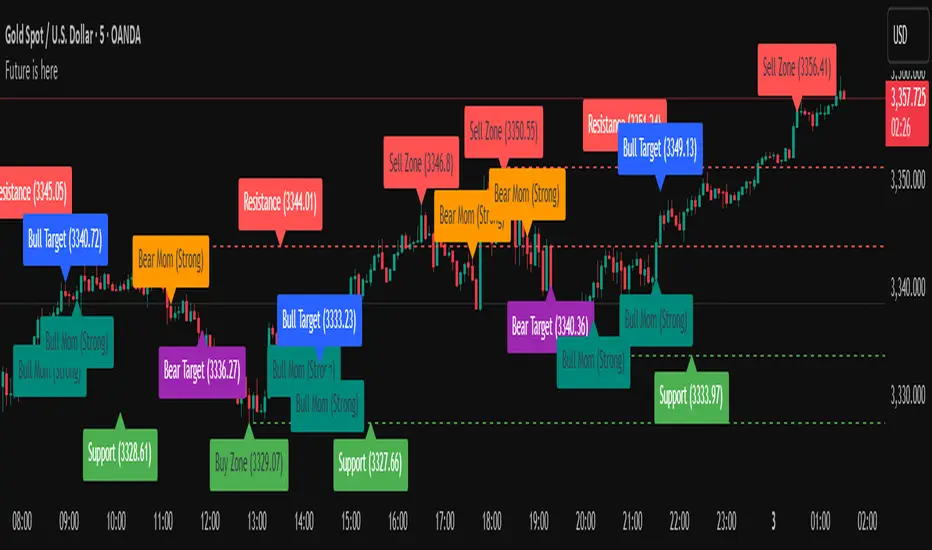
GM Institutional LevelsGM Institutional Levels is a clean price-level indicator designed to highlight important psychological market levels where price may react, pause, reject or break through.
The indicator was originally built from my round-number logic on USDNOK and later adapted for Gold and other markets.
It separates levels into:
Minor Institutional Levels
Major Institutional Levels
For Gold, the default structure uses:
$50 Minor Institutional Levels
$100 Major Institutional Levels
The indicator also includes presets for Gold, Forex, Indices, Crypto and Custom markets, together with price labels, a dashboard and optional alerts when price approaches or crosses an important level.
These levels are not automatic buy or sell signals. They are intended as areas to watch for confirmation from price action, market structure, FVG/IFVG, divergence and other forms of confluence.
Main Features:
โข Minor and Major Institutional Levels
โข Gold, Forex, Index and Crypto presets
โข Custom level spacing
โข Full-chart horizontal levels
โข Price labels
โข Nearest-level dashboard
โข Proximity alerts
โข Cross alerts
โข Clean and simple chart layout
The goal of GM Institutional Levels is to keep the chart simple and focus attention on important psychological price areas.
Trade the level.
Wait for confirmation.
Execute the setup. Penunjuk

Penunjuk

Volume Pressure ZonesThe Volume Pressure Zones indicator identifies areas of concentrated buying and selling pressure by analyzing intra-bar price action and volume.
Rather than relying purely on price structure, this script estimates the internal volume pressure behind price movements. It splits the volume of each candle into Buy and Sell components based on where the candle closes relative to its high-low range.
How it Works:
Pressure Calculation: The script tracks the cumulative Buy and Sell volumes over a specified lookback period (default 6) and compares them against the average volume.
Zone Projection: When the concentrated pressure exceeds a user-defined threshold (default 1.3), it projects a visual zone forward.
Buy Zones (White): Represent areas of concentrated buying pressure, potentially acting as support.
Sell Zones (Black): Represent areas of concentrated selling pressure, potentially acting as resistance.
Overlap Prevention: To maintain a clean and readable chart, the script prevents new boxes of the same type from overlapping. A new zone is drawn only after the previous zone's extension period has fully elapsed.
Settings:
Pressure Threshold: Adjusts the sensitivity of zone creation. A higher value requires a stronger concentration of volume to draw a box.
Zone Extension: Determines how many bars forward the support/resistance box is projected.
Moving Average (Optional): An optional EMA is included with slope-based color coding for trend context. This is hidden by default to keep the chart clean.
This indicator does not predict future price movements but provides a visual mapping of where significant volume pressure has recently occurred. It is best used alongside other contextual market analysis.
How to Use (Trading Strategies & Applications):
1. The Pullback & Retest Strategy
These zones represent areas where significant capital was committed. Rather than entering a trade immediately as the zone forms, wait for the initial move to play out and look for a pullback to the zone.
Bullish Setup: Wait for a White (Buy) zone to form and price to move higher. When the price retraces back into this white zone, look for bullish rejection (e.g., a pin bar or engulfing candle) to enter long.
Bearish Setup: Wait for a Black (Sell) zone to form and price to drop. Sell on the retracement back into the black zone, using it as a resistance ceiling.
2. Trend Alignment (Using the Optional MA)
To avoid trading against the dominant momentum, use the built-in Moving Average (or your own preferred trend filter) to select high-probability zones.
Enable the Moving Average in the settings.
If the price is trading above a rising MA, prioritize White (Buy) zones for long entries and ignore black zones.
If the price is trading below a falling MA, prioritize Black (Sell) zones for short entries and ignore white zones.
3. Dynamic Risk Management (Stop Loss & Take Profit)
The zones provide logical, volume-backed levels for managing your risk and targeting profits.
Stop Loss Placement: When taking a long position from a support area, place your stop loss just below the bottom edge of the current White (Buy) zone.
Take Profit Placement: If you are in a long position, use the nearest developing or existing Black (Sell) zone as a realistic take-profit target, as it represents historical selling pressure.
4. Breakout Validation
When the price approaches a previously established pressure zone, observe how volume and price behave. If the price easily breaks through a thick Black (Sell) zone with strong momentum, it indicates that the buyers have fully absorbed the historical selling pressure. This invalidated resistance zone often flips to become future support.
Disclaimer: Like all technical indicators, Volume Pressure Zones should not be used in isolation. It works best when combined with broader market structure analysis, price action, and proper risk management. Penunjuk

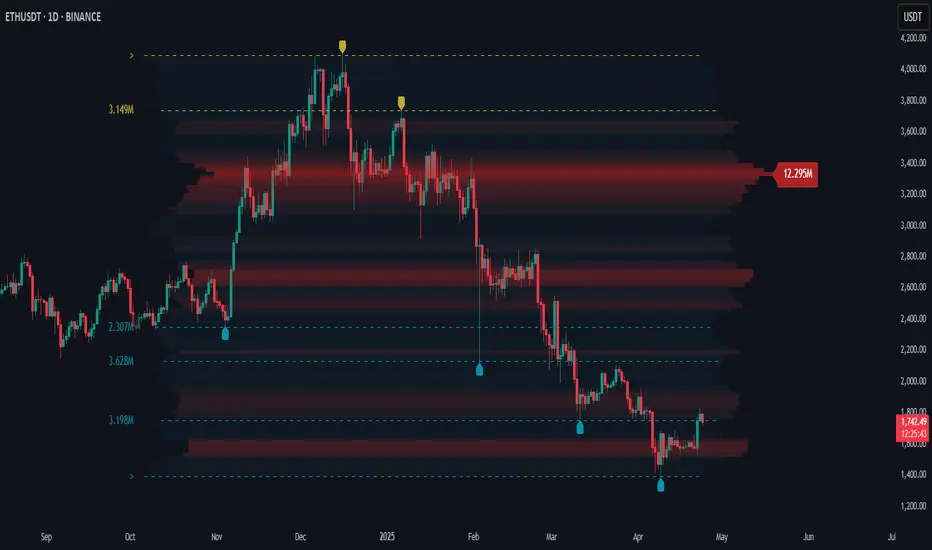
Reversal Probability Profile [AlgoAlpha]๐ OVERVIEW
Reversal Probability Profile maps where confirmed price reversals have historically concentrated. Instead of treating every support or resistance level equally, it builds a price-based profile from confirmed pivot highs and lows and shows which areas have produced the greatest concentration of reversals.
The profile combines pivot-based support and resistance, reversal density, price clustering, and a maximum reversal zone. This gives traders a structured view of where price has repeatedly changed direction and how the density at one level compares with the strongest reversal area in the current calculation range.
Active support and resistance levels also display a normalized Reversal Probability. This value represents the reversal density at that level relative to the highest-density profile bin. It is a relative density measure, not a statistical forecast of the probability that price will reverse.
๐ CONCEPTS
Pivot High โ A confirmed local high where price is higher than the surrounding bars defined by the Pivot Left Bars and Pivot Right Bars settings. These pivots represent historical bearish reversal points.
Pivot Low โ A confirmed local low using the same left and right confirmation structure. These pivots represent historical bullish reversal points.
Reversal Probability Profile โ A price profile built from confirmed pivot highs and lows. Each pivot contributes to its corresponding price bin and nearby bins according to the Bin Smoothing Radius.
Reversal Probability โ The density of a price bin divided by the density of the tallest profile bin. The tallest bin is therefore 100%, while other levels are expressed relative to it. This measures relative historical reversal density rather than a statistical probability of a future reversal.
Max Reversal Zone โ The price bin containing the highest smoothed pivot count. It forms the profile's point of maximum reversal density.
Pivot Clusters โ Groups of historical pivot prices with similar price locations. The script groups these prices into clusters and uses separate colors to make recurring reversal regions easier to distinguish.
Support and Resistance Levels โ Horizontal levels created from confirmed pivot lows and highs. Nearby levels can be filtered using an ATR-based overlap distance so that similar pivots do not produce excessive duplicate levels.
๐ FEATURES
Reversal Probability Profile โ Displays historical reversal density across the visible calculation range, with wider bins representing greater density relative to the maximum reversal zone.
Probability-Labeled Support and Resistance โ Displays active pivot levels together with their price and normalized Reversal Probability, while broken levels can remain as faint historical references.
Max Reversal Zone โ Highlights the profile bin with the greatest concentration of confirmed reversals and marks its corresponding price level.
Cluster Visualization โ Color-codes pivot regions and can display cluster levels and historical pivot markers to show where reversal prices have grouped.
Reversal Alerts โ Provides alerts for new support and resistance pivots, level breaks, maximum or high-density zone touches, and bullish or bearish reversal-zone touches.
๐ HOW TO USE
Start with the profile โ Look for the widest sections. These show price regions where confirmed reversals have concentrated more heavily than surrounding areas.
Use the Max Reversal Zone as a reference โ It represents the strongest reversal-density bin in the current calculation window and provides the 100% reference used by the other probability values.
Compare active levels by Reversal Probability โ A level closer to 100% sits in a region with reversal density closer to the profile maximum. Treat this as relative historical density rather than a forecast of future reversal odds.
Distinguish support from resistance โ Green support levels originate from pivot lows, while red resistance levels originate from pivot highs. Watch how price behaves when it returns to these areas.
Read clusters as broader areas of interest โ Repeated pivots near similar prices form clusters. These can help identify reversal regions that are supported by several historical turning points instead of one isolated pivot.
Use broken levels for context โ When enabled, previously broken support and resistance remain visible as faint dotted references. This helps separate active levels from historical structure.
Adjust Pivot Left Bars and Pivot Right Bars to control sensitivity โ Lower values identify smaller local turns. Higher values require broader price structure before a pivot is confirmed.
Adjust the Calculation Lookback and Pivot Memory to control how much historical reversal structure contributes to the current profile.
Use the profile together with current price action โ A high-density zone identifies where reversals occurred historically. It does not by itself confirm that price will reverse on the next test.
๐ CONCLUSION
Reversal Probability Profile combines confirmed pivots, support and resistance, reversal-density profiling, and price clustering in one chart view. It gives traders a relative measure of where reversals have historically concentrated and a way to compare current price levels against the strongest reversal zone.
Penunjuk

CCI Divergence Volume Breakout [josseliani]CCI Divergence Volume Breakout combines confirmed CCI divergence with a relative-volume candle level. It waits for a confirmed close beyond that candle's high or low before displaying a BUY or SELL signal, and it can optionally map Entry, a volume-candle-based stop, 1R, and historical R-reach statistics.
The default settings are tuned for XAUUSD on the 7-minute chart, but the indicator can be adapted to other instruments and timeframes. The statistics dashboard updates for the current symbol, timeframe, loaded chart history, and selected inputs, making it easy to see how different settings affect the sample size and historical R-reach rates.
โ HOW I USE IT
The default settings are the configuration I currently use for XAUUSD on the 7-minute chart.
Seven minutes is the favorite timeframe of my wonderful wave-analysis teacher. I built this version around the way he studies the market: first CCI divergence, then a meaningful volume spike. After that, he moves on to his own wave-analysis methods, including trendlines, wave count, structure, and broader market context. This indicator does not reproduce or replace his complete method. I use it as a supporting tool within my own wave analysis.
With the default settings, the script first searches for a confirmed CCI divergence. It then selects a qualifying volume candle connected to that divergence. The first search covers the divergence span; if necessary, it checks the area around the second pivot and then watches the post-confirmation candidate window. A qualifying candle must have volume of at least 1.5 times its 20-bar average.
For a bullish divergence, the high of the selected volume candle becomes the confirmation level. A BUY signal appears only after a candle closes above that high within the permitted breakout window.
For a bearish divergence, the low of the selected volume candle becomes the confirmation level. A SELL signal appears only after a candle closes below that low within the permitted breakout window.
The optional trade map starts from the open of the candle after the signal. It displays an Entry line, a stop behind the opposite edge of the exact volume candle plus the selected ATR delta, and a 1R reference target.
I use the dashboard to compare configurations rather than to treat one historical percentage as a promise. For example, changing the minimum volume multiple, pivot-matching radius, maximum distance between pivots, candidate-search window, or breakout window changes how often historical observations reached 0.5R, 1R, 2R, and 3R. This helps me see the trade-off between signal selectivity and historical excursion.
โ HOW THE INDICATOR WORKS
โ 1. Automatic CCI pivot scan
The script evaluates confirmed CCI pivots using strengths 3, 5, 7, and 9. The first pivot must be beyond the selected extreme threshold. The second pivot may form closer to the center of the oscillator.
A bullish divergence requires price to form a lower low while CCI forms a higher low. A bearish divergence requires price to form a higher high while CCI forms a lower high.
CCI pivots require bars on the right to become confirmed. For that reason, divergence lines are anchored to their historical pivot candles only after confirmation. They do not represent information that was available on the original pivot candle. BUY and SELL signals are evaluated only on confirmed closes after the divergence has been confirmed.
โ 2. Price-pivot matching
CCI and price do not always turn on exactly the same candle. Price Pivot Match Radius searches on both sides of each CCI endpoint for the corresponding price high or low.
Maximum Price/CCI Span Difference then checks that the two price pivots and the two CCI pivots describe approximately the same market swing. Lower values require tighter alignment; higher values allow more flexibility.
โ 3. Relative-volume candle selection
When a divergence becomes confirmed, the script first searches its pivot-to-pivot span for qualifying volume candles and selects the qualifying candle with the greatest reported volume. If that search finds none, it also checks the area around the second pivot. Search After Divergence then defines how many new bars after confirmation may supply a qualifying candidate. Volume is measured relative to its moving average:
Relative volume = candle volume / average volume
The default requirement is 1.5 times the 20-bar average. Candle direction is not used. For a bullish setup, the selected candle's high becomes the level. For a bearish setup, its low becomes the level.
Maximum Candidates controls how many qualifying volume levels one divergence may create. You can use up to three qualifying volume-candle candidates for each confirmed divergence. The default is one to keep the chart and signal source unambiguous. With this default, an already selected historical candidate fills the single slot; otherwise, the first qualifying post-confirmation candidate can fill it.
โ 4. Breakout confirmation and signal window
The volume level begins as gray. It changes to the bullish or bearish color only when price closes beyond it on a confirmed candle:
Bullish divergence: confirmed close above the selected volume candle's high.
Bearish divergence: confirmed close below the selected volume candle's low.
Breakout Signal Window defines how many bars that exact volume level is permitted to produce a BUY or SELL signal. The count begins when the level is created. Once the window expires, the level cannot trigger a late signal and cannot add a late observation to the statistics.
โ 5. Expired levels
Keep Expired Levels Visible separates signal validity from visual analysis.
When it is enabled, an unbroken level continues as a gray reference after its signal window expires. The expired line is visual only: it cannot produce a BUY or SELL signal and is not reactivated by a new calendar day, exchange day, or session. It remains visible until a newer qualifying volume level replaces it.
When Keep Expired Levels Visible is disabled, the gray line ends when its breakout signal window expires.
This indicator does not carry or re-arm levels according to a calendar boundary or timezone.
โ OPTIONAL TRADE MAP
The trade map is a visual measurement tool, not an automated order-placement system.
Entry: open of the candle following the confirmed BUY or SELL signal.
Stop: opposite edge of the exact volume candle that produced the signal, plus the selected ATR delta.
1R: one initial-risk unit from Entry.
The map helps compare the signal with the user's own execution, market structure, and risk plan. It is not financial advice and does not account for spread, slippage, commissions, or individual position sizing.
โ STATISTICS DASHBOARD
The dashboard reports historical reach rates for the current symbol, timeframe, loaded chart history, and selected inputs. It is designed for configuration comparison.
Completed: observations that reached the stop, reached 3R, or reached the maximum evaluation window.
Reached >=0.5R: completed observations whose maximum favorable excursion reached at least half of the initial risk.
Win Rate >=1R: completed observations that reached at least 1R before the stop.
Reached >=2R / >=3R: completed observations that reached those excursion levels before the stop.
Average MFE: average maximum favorable excursion, expressed in R, across completed observations.
Active / Invalid: observations still being evaluated and observations rejected because a valid positive risk distance could not be constructed.
Only breakouts confirmed while their volume level is inside its active signal window create statistical observations. An expired gray reference does not create a trade in the dashboard.
If the stop and a target fall inside the same historical candle, the script gives the stop priority because OHLC data cannot reveal the intrabar sequence. This is intentionally conservative.
These figures are descriptive historical measurements, not a backtest equity curve, not a profit factor, and not a forecast of future results. They can change with the data provider, symbol, timeframe, available history, and settings.
โ DEFAULT XAUUSD 7-MINUTE PRESET
CCI Length: 20
CCI Source: Typical Price (HLC3)
First Pivot Extreme Level: +/-150
Maximum Bars Between Pivots: 60
Price Pivot Match Radius: 7
Maximum Price/CCI Span Difference: 35%
Volume Average Length: 20
Minimum Volume x Average: 1.5
Search After Divergence: 15 bars
Maximum Candidates per Divergence: 1
Breakout Signal Window: 40 bars
Keep Expired Levels Visible: On
Show Entry / SL / 1R Markup: On
โ ALERTS
Bullish CCI Divergence: fires when a bullish divergence becomes confirmed.
Bearish CCI Divergence: fires when a bearish divergence becomes confirmed.
CCI Volume Long Signal: fires after a confirmed close above an active bullish volume level.
CCI Volume Short Signal: fires after a confirmed close below an active bearish volume level.
โ ORIGINALITY
This script is not a standard CCI divergence plot and not a generic volume-spike marker. Its purpose is to connect four separate stages in one workflow: multi-strength confirmed CCI divergence, price-pivot alignment, relative-volume candle mapping, and close-confirmed breakout authorization.
Candidate search, signal lifetime, visual reference lifetime, trade measurement, and historical R-reach analysis are kept separate. This makes it possible to change one part of the workflow and see how it affects signal frequency and the historical statistics without confusing an expired visual level with an active signal source.
โ LIMITATIONS
CCI, volume, and divergence are analytical tools, not guarantees of reversal or continuation. Pivot confirmation introduces an intentional delay. Historical volume and results can differ between data providers. Signals should be evaluated with market structure, liquidity, volatility, wave context, and personal risk management. The default preset was developed for how I analyze XAUUSD on 7 minutes; other markets and timeframes require independent testing.
Penunjuk

Multi EMA SMA Pro - 5/13/20/50/100/200 - MTFMULTI EMA/SMA PRO โ 5/13/20/50/100/200 + MTF
Nine independent moving averages in one indicator, each with its own length,
type, timeframe, color and width. Defaults give you the classic 20 / 50 / 100 /
200 on your chart timeframe, with 5 and 13 a click away.
EVERY LINE IS LABELLED
No more guessing which line is which. Each average is tagged at the right edge
with its length โ and optionally its type, its timeframe, its current value, and
how far price sits from it in percent. You read "200 D +18.06%" straight off the
chart instead of hovering over lines to find out.
DAILY / WEEKLY / MONTHLY AVERAGES ON ANY CHART
Every slot has a Chart / Daily / Weekly / Monthly / Custom selector, so you can
sit on a 5-minute chart and still see exactly where the daily 200 and the weekly
200 are โ the levels that actually decide intraday reversals. Slots 7, 8 and 9
come pre-set to 200 D, 30 W and 200 W. Each higher-timeframe line is tagged with
D, W or M so there is never any ambiguity about what you are looking at. Ask for
a timeframe below your chart and the slot quietly falls back to chart data rather
than returning misleading values.
INFO TABLE
An on-chart panel lists every enabled average, its current value, and how far
price is above or below it in percent, color-coded green and red. It is the
fastest way to tell whether price is extended and due a snap back, or resting on
support. Decimal precision is adjustable.
GOLDEN CROSS / DEATH CROSS, DONE PROPERLY
GC/DC detection is on by default and measured on the DAILY 50 vs 200 no matter
what timeframe you are viewing โ so an intraday chart shows the real cross, not a
5-minute imitation of one. Markers carry their own context: "GC 50/200 D".
Lengths, timeframe and MA type are all configurable, or you can point the cross
logic at any two of your plotted lines instead.
EVERYTHING ELSE
- EMA / SMA / WMA / HMA / RMA / VWMA globally, or overridden per line
- Custom source, plot offset, transparency, per-line width and color
- Line / step-line / circles / cross plot styles
- Slope-based coloring (green rising, red falling)
- Ribbon fill between any two averages
- Alerts for price crossing each average, plus golden and death cross
- Palette chosen to stay readable on both light and dark chart backgrounds
A NOTE ON HIGHER-TIMEFRAME DATA
Leave "wait for bar close" off and the daily and weekly lines update live inside
the forming candle, which is usually what you want when trading. The trade-off is
that an intraday cross can appear and then disappear before the session closes.
Turn it on for confirmed, non-repainting values that step one bar late.
If you find this useful, a boost is appreciated. Suggestions and feedback welcome in the comments.
Open-source โ feel free to study, fork, and adapt. Penunjuk

NASDAQ Pre-Market Range Sweep [josseliani]NASDAQ Pre-Market Range Sweep is an intraday trading assistant built around a familiar pre-market range sweep-and-reclaim setup. It automatically maps the NASDAQ range formed between 08:00 and 09:00 New York time, then monitors price behavior as activity increases ahead of the 09:30 cash-session open. The main idea is simple: after price sweeps liquidity beyond one side of the pre-market range, it may either continue moving away or return inside the range and move toward its midpoint or opposite boundary. Instead of requiring users to draw these levels manually and monitor every candle, the indicator plots the range, qualifies the sweep, waits for one of two entry confirmations, marks Entry and TP1, and collects historical statistics for the same setup.
This is an indicator, not a TradingView strategy. It does not place orders or manage positions.
WHY THIS RANGE
By default, the range is built from M1 candles between 08:00 and 09:00 in the America/New_York time zone.
This hour captures a defined part of the NASDAQ pre-market before the transition into the more active New York morning and the 09:30 cash-session open. Once this period is complete, the indicator fixes: โ Range High โ Range Low โ the 50% midpoint
With the default one-minute delay, sweep monitoring begins at 09:01 New York time.
The range levels can remain visible for a fixed number of minutes or extend until the next daily range begins.
QUALIFIED LIQUIDITY SWEEP
A small wick through Range High or Range Low is not enough to qualify as a sweep.
The entire M1 candle must be outside the range: โ for an upper sweep, the candleโs low must be above Range High โ for a lower sweep, the candleโs high must be below Range Low
By default, the outside candle must also take the nearest previously confirmed pivot on the same side. This optional structural filter helps distinguish a more substantial liquidity event from a minor extension beyond the range.
A qualified sweep is not an immediate entry. The indicator then waits for one of two confirmations: Range Reclaim or Pivot Entry.
RANGE RECLAIM
Range Reclaim is used when price returns inside the pre-market range after the sweep.
For a BUY after a lower sweep, the indicator waits for a closed M1 candle that: โ closes inside the range โ has at least 70% of its body inside the range under the default settings
Once that candle has closed, its high becomes the confirmation level. BUY is displayed when price subsequently breaks that high.
For a SELL after an upper sweep, the logic is reversed: the acceptance candle closes inside the range, and SELL is confirmed when price subsequently breaks its low.
For Range Reclaim: โ Entry is the high or low whose break confirmed the signal โ TP1 ยท Partial close is placed at the 50% midpoint of the range
The midpoint is used as the first structural objective because price has returned inside the range but is not guaranteed to reach the opposite boundary.
PIVOT ENTRY
Pivot Entry is designed for cases where price continues significantly beyond the swept range boundary.
The search for this entry is activated only after price has moved at least one complete range width beyond that boundary.
The indicator then waits for a new confirmed pivot to form outside the range: โ after a lower sweep, it looks for a confirmed pivot high below Range Low and a subsequent break above it โ after an upper sweep, it looks for a confirmed pivot low above Range High and a subsequent break below it
For Pivot Entry: โ Entry is placed at the broken pivot level โ TP1 ยท Partial close is placed at the nearest boundary of the original range
If Range Reclaim and Pivot Entry are confirmed on the same M1 candle, only one signal is recorded.
SIGNAL CONTROL
The same acceptance candle or confirmed pivot cannot generate repeated signals.
After a BUY, another BUY requires a genuinely new low beyond the extreme of the previous outside movement. After a SELL, another SELL requires a genuinely new high. The number of signals per range is also limited by the Maximum signals per range setting.
Once price reaches the opposite boundary of the range, the current range cycle is considered complete, and no additional signals are generated until the next range.
CHART DISPLAY
The indicator can display: โ Range High and Range Low โ the 50% midpoint โ confirmed BUY and SELL arrows โ Entry โ TP1 ยท Partial close โ the statistics table
BUY and SELL arrows show that one of the two confirmation models has been completed. Entry marks the level whose break confirmed the setup. TP1 ยท Partial close marks the first structural reference: โ the range midpoint for Range Reclaim โ the nearest range boundary for Pivot Entry
The trade markup is an analytical reference. It does not represent an automatically executed order or a guaranteed target.
TIMEFRAMES
All signal calculations are performed using M1 data.
On M1, the indicator displays the original signals together with the Entry and TP1 markup. On M5 and M15, it displays markers cloned from the original M1 events. It does not recalculate the setup using M5 or M15 candles. This allows the same M1 signals to be viewed within a wider market context.
Timeframes above M15 are not supported.
STATISTICS TABLE
The statistics table provides a historical view of how price behaved after a qualified sweep. For each completed range, the table evaluates the first qualified sweep found within the observation window.
Return depth is normalized according to the width of each individual range: โ 0% = the swept boundary โ 50% = the range midpoint โ 100% = the opposite boundary
OVERVIEW
Completed ranges โ the number of completed observations. An observation ends when price reaches the opposite boundary or when the statistics look-forward window expires.
Qualified sweeps โ the number of completed ranges in which a qualified sweep occurred. The percentage is calculated from all completed ranges.
Returned into range โ the number and percentage of qualified sweeps followed by at least some movement back inside the range.
Full opposite edge โ the number and percentage of qualified sweeps that eventually reached the opposite range boundary.
RETURN DEPTH
Average return (>0) โ the average maximum return depth among sweeps that produced a positive return. A complete return is capped at 100%.
Minimum return (>0) โ the smallest positive return recorded in the sample.
0โ25%, 25โ50%, 50โ75%, 75โ90%, and 90โ99% โ the distribution of incomplete returns that did not reach the opposite boundary.
These rows show how far price most often returned. They are useful because waiting for the opposite boundary in every case may not be realistic.
RISK & TIME
Average adverse excursion โ the average maximum distance that price continued moving away from the range after the qualified sweep. It is expressed as a percentage of that rangeโs width.
Maximum adverse excursion โ the largest such movement recorded in the available sample.
For example, a maximum adverse excursion of 600% means that, in the most extreme historical case, price continued approximately six range widths farther away before the observation ended.
Average time to 20% โ the average number of minutes from the sweep until price completed a 20% return.
Average time to 50% โ the average number of minutes from the sweep until price reached the range midpoint.
Average time to full โ the average number of minutes from the sweep until price reached the opposite boundary.
These values help estimate how long the historical return process usually took rather than assuming that it should happen immediately.
BREAK-EVEN SIMULATION
BE armed / stopped / later full is a statistical simulation only.
It shows: โ how many events reached the selected return depth and activated the hypothetical protection level โ how many subsequently returned to that simulated protection level โ how many of those stopped cases later reached the opposite boundary anyway
The simulation does not move a real stop, alter the signals, or manage a trade.
EXAMPLE OF READING THE TABLE
The table shown in this example contains:
โ Completed ranges: 18
โ Qualified sweeps: 18 | 100%
โ Returned into range: 16 | 88.89%
โ Full opposite edge: 5 | 27.78%
Completed ranges: 18
The indicator completed 18 statistical observations on the available chart history.
An observation is considered complete when either:
โ price reaches the opposite boundary of the range
โ the Statistics look-forward window expires
This number does not represent 18 trades. It represents 18 completed range observations.
Qualified sweeps: 18 | 100%
A qualified sweep was found in all 18 completed observations.
The 100% is calculated as:
โ 18 qualified sweeps รท 18 completed ranges
For the statistics, only the first qualified sweep found within each range observation is evaluated.
Returned into range: 16 | 88.89%
After 16 of the 18 qualified sweeps, price made at least some positive movement back inside the range.
The percentage is calculated as:
โ 16 returns รท 18 qualified sweeps = 88.89%
This does not mean that all 16 events reached the midpoint or the opposite boundary. It means only that price moved back inside the range by more than 0%.
Full opposite edge: 5 | 27.78%
In 5 of the 18 qualified sweep events, price moved through the entire range and reached its opposite boundary.
The percentage is calculated as:
โ 5 full returns รท 18 qualified sweeps = 27.78%
This is an important distinction. In this sample, price returned inside the range in 88.89% of the events, but it completed the full journey to the opposite boundary in only 27.78%.
The table therefore helps avoid the assumption that every successful return should be held all the way to the other side of the range.
RETURN DEPTH
The same example shows:
โ Average return (>0): 66.2%
โ Minimum return (>0): 3.33%
Average return (>0): 66.2%
Among the 16 events that produced a positive return, the average maximum return depth was 66.2% of the corresponding range width.
The calculation includes partial returns and full returns. A return that reaches the opposite boundary is capped at 100%.
This does not mean that every event returned 66.2%. It means that 66.2% was the average maximum depth across the positive-return sample.
Minimum return (>0): 3.33%
The smallest positive return in the sample was only 3.33% of the range width.
Events with no positive return are not included in this minimum calculation. This row shows the weakest recorded return that was still greater than zero.
INCOMPLETE RETURN DISTRIBUTION
The example contains:
โ 0โ25%: 4 | 30.77%
โ 25โ50%: 2 | 15.38%
โ 50โ75%: 5 | 38.46%
โ 75โ90%: 2 | 15.38%
โ 90โ99%: 0 | 0%
Five events reached the full opposite boundary and are therefore excluded from these incomplete-return groups.
That leaves:
โ 18 qualified sweeps โ 5 full returns = 13 incomplete returns
The percentages in this section are calculated from these 13 incomplete events, not from all 18 qualified sweeps.
0โ25%: 4 | 30.77%
Four of the 13 incomplete observations returned by less than 25% of the range width.
This group also includes events with a 0% return. Therefore, not every event in the 0โ25% group necessarily moved back inside the range.
25โ50%: 2 | 15.38%
Two incomplete observations returned through at least 25% of the range but did not reach its midpoint.
50โ75%: 5 | 38.46%
Five incomplete observations reached the midpoint and continued beyond it, but did not reach 75% of the range.
This was the largest incomplete-return group in the example.
75โ90%: 2 | 15.38%
Two observations returned through at least 75% of the range but stopped before reaching 90%.
90โ99%: 0 | 0%
None of the incomplete observations stopped between 90% and 99%.
Events that reached 100% are counted separately under Full opposite edge.
ADVERSE EXCURSION
The example shows:
โ Average adverse excursion: 189.34%
โ Maximum adverse excursion: 665.07%
Adverse excursion measures how far price continued moving away from the swept boundary after the qualified sweep.
It is also normalized according to the width of the corresponding range.
Average adverse excursion: 189.34%
On average, price traveled approximately 1.89 range widths farther away from the swept boundary during the observed events.
This number shows why a liquidity sweep should not automatically be treated as an immediate reversal or as an entry without confirmation.
Maximum adverse excursion: 665.07%
In the most extreme observation, price continued approximately 6.65 range widths beyond the swept boundary.
This does not mean that every setup requires such a large stop. It shows the largest historical extension found in the available sample and demonstrates that price can continue significantly farther after a sweep.
TIME STATISTICS
The example shows:
โ Average time to 20%: 14.86 min
โ Average time to 50%: 23.75 min
โ Average time to full: 30 min
These values are measured from the qualified sweep.
Average time to 20%: 14.86 min
Among the observations that reached a 20% return, the average time required was 14.86 minutes.
Events that never reached 20% are not included in this average.
Average time to 50%: 23.75 min
Among the observations that reached the range midpoint, the average time required was 23.75 minutes.
Events that never reached 50% are not included.
Average time to full: 30 min
Among the five observations that reached the opposite boundary, the average time required to complete the full return was 30 minutes.
This does not mean that a full return should always occur within 30 minutes. It describes only the average of the completed full-return cases in this sample.
BREAK-EVEN SIMULATION
The example shows:
โ BE armed / stopped / later full: 14 / 10 / 4
With the default 20% activation setting, this means:
โ 14 events reached at least a 20% return and activated the hypothetical protection level
โ 10 of those events subsequently returned to the simulated protection level
โ 4 of those 10 events later reached the opposite boundary anyway
This row helps examine whether protecting a position after the first part of the return might remove exposure from some events that would later continue to the full target.
It is a statistical simulation only. It does not place a stop, move a stop, change the signals, or manage a real position.
WHAT THE TABLE TELLS ME
In this particular sample, the table shows that a return inside the range occurred much more frequently than a complete move to the opposite boundary.
It also shows:
โ how deep the average return was
โ how shallow the weakest positive return was
โ where incomplete returns most often stopped
โ how long different stages of the return usually took
โ how far price sometimes continued away from the range before returning or before the observation ended
The purpose of the table is not to prove that the setup will work in the future. It provides a structured statistical view of the price behavior visible on the current chart, symbol, data feed, and settings.
HOW I USE IT
I use the indicator on a NASDAQ M1 chart and first wait for the pre-market range to be completed.
After 09:00 New York time, I watch for a qualified sweep of one of the boundaries. The sweep itself is not my entry.
I then wait for either: โ a confirmed return inside the range through Range Reclaim โ a confirmed pivot break after a deeper movement outside the range
The arrow shows that one of these confirmation conditions has been completed. Entry marks the confirmation level and the potential trade-entry level. TP1 ยท Partial close marks the first structural area where a partial exit or closer observation of the price reaction may be considered.
The default settings and presets are built for the NASDAQ sweep-and-reclaim strategy around the New York pre-market open. The same logic can also be used on other instruments, including FX pairs and gold. On gold, you can keep the same New York pre-market range; the market will simply produce its own statistics. On EURUSD, for example, you can build a London session window by adjusting Range start hour / minute and Range length (still entered in New York time).
Use the statistics table to judge how clean the setup looks on that symbol and those settings, and build the variation that fits you: โ try different instruments and currency pairs โ try different chart timeframes โ choose your own pre-market hour and range length โ decide from the table whether the setup is worth trading there
MAIN SETTINGS
Range start hour / minute โ sets the beginning of the range in New York time.
Range length โ sets the duration of the range.
Start watching after range end โ sets the delay before sweep monitoring begins. The default value of one minute starts monitoring at 09:01.
Statistics look-forward window โ sets how long each sweep is observed for the statistics table.
Signal window mode โ limits signal generation to a fixed period or allows it to continue until the next range.
Signal window โ sets the duration of the fixed signal-search period.
Maximum signals per range โ limits the number of confirmed signals for one range.
Minimum reclaim body inside range โ sets how much of the closed acceptance candleโs body must be inside the range.
Require nearest confirmed pivot sweep โ requires the outside candle to take the nearest confirmed pivot.
Pivot strength โ controls the size and confirmation delay of local pivots.
Level extension โ extends the range levels for a fixed period or until the next range.
Trade markup length โ controls the length of the Entry and TP1 lines.
ORIGINALITY
Pre-market ranges, liquidity sweeps, and confirmed pivots are established market concepts. The originality of this implementation lies in how these elements are combined and managed as one complete process.
The script: โ requires the entire M1 candle to move outside the range โ can require the nearest confirmed pivot to be swept โ separates the liquidity event from the entry confirmation โ provides two distinct confirmation models: Range Reclaim and Pivot Entry โ activates Pivot Entry only after a one-range-width excursion โ prevents the same candle or pivot from producing repeated signals โ requires a new external extreme before another same-direction signal can occur โ terminates the cycle after price reaches the opposite boundary โ includes a normalized statistics table designed specifically to evaluate this range-sweep setup
The table is not intended to present a strategy win rate. It provides a statistical view of the underlying idea: how often qualified sweeps occurred, how often price returned inside the range, how frequently it reached the opposite boundary, the average and minimum return depth, the time required for different stages of the return, and the adverse distance price sometimes traveled before returning or before the observation ended.
This helps users evaluate the historical behavior of the setup instead of assuming that every sweep must produce a complete return or that every return should take the same amount of time.
The indicator is published free and open-source so that users can inspect the calculations and verify how the signals and statistics are produced.
LIMITATIONS
Results can differ between NASDAQ symbols, exchanges, and data feeds because the calculations depend on M1 OHLC data.
Confirmed pivots require bars on their right side and therefore become available only after a structural confirmation delay.
M5 and M15 display cloned M1 events, not independently calculated higher-timeframe signals.
The statistics describe only the available historical sample under the current settings. They are not a strategy report and do not guarantee future results.
The indicator does not account for commissions, slippage, position size, or individual stop-loss placement. Entry, TP1, and the break-even simulation are analytical references, not automated trade-management instructions. Penunjuk

Sattam | option-scalpVolatility Projection Zones
Every 52 bars the indicator takes a reading of the market and projects where
price could travel next, based on how volatile the market actually is right now.
WORKS ON EVERY MARKET โ AND HOLDS UP ON OPTIONS
There is not a single fixed value anywhere in this script: no pip counts, no
point targets, no price assumptions. Every distance it draws is derived from the
instrument's own volatility, so it behaves the same way on futures, forex,
indices, crypto, stocks โ and on options contracts, which is where most
ATR-based tools quietly fall apart.
Options are a hostile case: premiums move in cents, a contract can lose half its
value in three bars, sessions are full of gaps, and plenty of bars print with no
trade at all. A pure ATR projection lags badly through moves like that and draws
targets far too tight. This script handles it by taking the LARGER of two
measures โ the ATR projection, or the range of the anchor window itself. On
liquid futures the ATR is always the larger one and the floor never shows; on an
option, when a window holds a collapse, the window wins and the projection stays
honest.
HOW IT WORKS
At each cycle the script looks at the last 3 bars and finds the extreme that
price has moved furthest away from โ if price is sitting near the top of that
little range, the low becomes the anchor, and vice versa. From that anchor it
projects a distance equal to 3 x ATR(14), or the range of those 3 bars when that
is wider.
Four lines are drawn per cycle:
- Two thick lines โ the anchor and the full projection target
- Two thin lines โ the 50% and 61.8% marks in between
Each set extends 49 bars, stopping just before the next cycle begins, and the
last 8 sets stay on the chart.
HOW TO READ IT
The direction of the projection is the cycle's bias. A set projecting upward
means the anchor sits below price as support, with the levels above as upside
reference. The two thin lines are the natural partial targets; the far thick
line is the full measured move.
Because the projection scales with volatility, the levels widen in fast
conditions and tighten in quiet ones automatically.
SETTINGS
Cycle length - bars between projections (default 52)
Anchor window - bars used to pick the anchor (default 3)
ATR length/mult - the projection distance (default 14 / 3.0)
Inner ratios - the two intermediate levels (0.5 / 0.618)
Cycle anchor - where the cycle starts counting: Session, Week, or a
manual phase
Display - colors, widths, line length, sets kept
NOTES
This is a levels framework, not a signal system. It draws on every cycle
regardless of trend or range conditions, and it has no entry filter of its own โ
combine it with your own read of structure and context.
Not financial advice. Test on your own instruments and timeframes before relying
on it.
ุฎุทูุท ุงููุฏู ุญุณุจ ุญุฑูุฉ ุงูุณูู
ุงูู
ุคุดุฑ ูู ูฅูข ุดู
ุนุฉ ูููู ููููุณ ูู ุงูุณููุ ูุจุนุฏูู ูู
ุฏ ุฃุฑุจุนุฉ ุฎุทูุท ุชููู ูู
ููู ู
ู
ูู ููุตู ุงูุณุนุฑ. ูุงูู
ุณุงูุฉ ู
ู ุฑูู
ูุชุจุชู ุฃูุงุ ูู ู
ู ุญุฑูุฉ ุงูุณูู ููุณู
ูู ุฐูู ุงููุญุธุฉ โ ุณูู ูุงูุฌ ูุนุทูู ุฎุทูุท ุจุนูุฏุฉุ ูุณูู ูุงุฏู ูุนุทูู ุฎุทูุท ูุฑูุจุฉ.
ูุดุชุบู ุนูู ูู ุงูุฃุณูุงู โ ูุฃููู ุดู ุนูู ุงูุงูุจุดู
ู
ุง ููู ูู ุงูู
ุคุดุฑ ููุง ุฑูู
ุซุงุจุช. ูุง ููุงุท ููุง ุจูุจุณ ููุง ุฃูุฏุงู ู
ุญููุธุฉ. ูู
ู
ุณุงูุฉ ูุฑุณู
ูุง ูุทูุนูุง ู
ู ุญุฑูุฉ ุงูุฃุฏุงุฉ ุงููู ุฃูุช ูููุง. ุนุดุงู ูุฐุง ููุณ ุงูุดุบู
ูู
ุดู ุนูู ุงูุฐูุจ ูุงูููุฑูุณ ูุงูู
ุคุดุฑุงุช ูุงูุนู
ูุงุช ุงูุฑูู
ูุฉ ูุงูุฃุณูู
ุ ููู
ุดู ุนูู
ุนููุฏ ุงูุงูุจุดู ูู
ุงู โ ููุฐู ุจุงูุฐุงุช ููู ุฃุบูุจ ุงูู
ุคุดุฑุงุช ุชุฎุฑุจ ูุฃูุช ู
ุง ุชุฏุฑู.
ููุด ุงูุงูุจุดู ุตุนุจุ ูุฃู ุณุนุฑ ุงูุนูุฏ ูุชุญุฑู ุจุงูุณูุชุงุชุ ูู
ู
ูู ุงูุนูุฏ ูุทูุญ ูุต
ููู
ุชู ูู ุซูุงุซ ุดู
ูุน ุจุณุ ูุงูุฌูุณุงุช ูููุง ูุฌูุงุช ูุซูุฑุฉุ ูุดู
ูุน ุชุนุฏู ุจุฏูู ููุง
ุตููุฉ. ู
ููุงุณ ATR ูุญุงูู ูุชุฃุฎุฑ ุนูู ุญุฑูุฉ ุฒู ูุฐุงุ ููุฑุณู
ูู ุฃูุฏุงู ูุฑูุจุฉ ู
ุง
ุชุณูู ุดู.
ุงูุญู ุงููู ููู: ููุงุฑู ุจูู ุดูุฆูู ููุงุฎุฐ ุงูุฃูุจุฑ โ ุฅู
ุง ู
ุณุงูุฉ ATRุ ูุฅู
ุง ู
ุฏู
ุงูุดู
ูุน ุงูุซูุงุซ ุงููู ุทูุนุช ู
ููุง ููุทุฉ ุงูุจุฏุงูุฉ. ูู ุงูุฃุณูุงู ุงูุนุงุฏูุฉ ATR ูุทูุน
ุฃูุจุฑ ุฏุงูู
ุงู ูู
ุง ุชุญุณ ุจูุงูุดู ุฃุตูุงูุ ููู ุงูุงูุจุดู ูู
ุง ุชุตูุฑ ุทูุญุฉ ูููุฉุ ู
ุฏู
ุงูุดู
ูุน ูุทูุน ุฃูุจุฑ ููุงุฎุฐู ุงูู
ุคุดุฑ โ ูุชุทูุน ุงูุฎุทูุท ูุงูุนูุฉ ู
ู ู
ุถุญูุฉ.
ููู ูุดุชุบู ุจุงูุถุจุท
ูู ุฏูุฑุฉ ูุดูู ุขุฎุฑ ูฃ ุดู
ูุนุ ููุดูู ุงูุณุนุฑ ุญุงููุงู ูุฑูุจ ู
ู ููู ููุง ู
ู ุชุญุช:
- ุงูุณุนุฑ ูุฑูุจ ู
ู ูููุ ูุงุฎุฐ ุงููุงุน ููุทุฉ ุจุฏุงูุฉ ููู
ุฏ ุงูุฎุทูุท ุทุงูุนุฉ
- ุงูุณุนุฑ ูุฑูุจ ู
ู ุชุญุชุ ูุงุฎุฐ ุงููู
ุฉ ููุทุฉ ุจุฏุงูุฉ ููู
ุฏ ุงูุฎุทูุท ูุงุฒูุฉ
ูุนูู ุฏุงูู
ุงู ูุจุฏุฃ ู
ู ุงูุทุฑู ุงูุฃุจุนุฏ ุนู ุงูุณุนุฑ.
ูู
ู ููุทุฉ ุงูุจุฏุงูุฉ ูุฐู ูููุณ ุงูู
ุณุงูุฉ (ูฃ ุฃุถุนุงู ATR ุฃู ู
ุฏู ุงูุดู
ูุน ุงูุซูุงุซุ
ุฃููู
ุฃูุจุฑ) ููุฑุณู
:
- ุฎุทูู ุณู
ูููู: ูุงุญุฏ ุนูุฏ ููุทุฉ ุงูุจุฏุงูุฉุ ููุงุญุฏ ุนูุฏ ุงููุฏู ุงููุงู
ู
- ุฎุทูู ุฑููุนูู ุจูููู
: ุนูุฏ ูฅู ูช ู ูฆูก.ูจูช ู
ู ุงูู
ุณุงูุฉ
ูู ู
ุฌู
ูุนุฉ ุฎุทูุท ุชู
ุดู ูคูฉ ุดู
ุนุฉ ูุชููู ูุจู ู
ุง ุชุจุฏุฃ ุงูู
ุฌู
ูุนุฉ ุงูุฌุฏูุฏุฉุ ููุจูู
ูู ุนูู ุงูุดุงุฑุช ุขุฎุฑ ูจ ู
ุฌู
ูุนุงุช.
ููู ุชูุฑุงู
- ุงูุฎุทูุท ุทุงูุนุฉ ูููุ ุงูุฏูุฑุฉ ู
ููููุง ุตุนูุฏุ ูููุทุฉ ุงูุจุฏุงูุฉ ุชุญุช ุชุตูุฑ ุฏุนู
- ุงูุฎุทูุท ูุงุฒูุฉ ุชุญุชุ ุงูุฏูุฑุฉ ู
ููููุง ูุจูุทุ ูููุทุฉ ุงูุจุฏุงูุฉ ููู ุชุตูุฑ ู
ูุงูู
ุฉ
- ุงูุฎุทูู ุงูุฑููุนูู: ุฃูุฏุงู ุฃููู ูุซุงููุฉุ ู
ูุงู ุทุจูุนู ุชุฌูู ููู ุฌุฒุก
- ุงูุฎุท ุงูุณู
ูู ุงูุจุนูุฏ: ุงููุฏู ุงููุงู
ู ููุญุฑูุฉ
ุงูุฅุนุฏุงุฏุงุช
Cycle length - ูู ูู
ุดู
ุนุฉ ูุฑุณู
ู
ุฌู
ูุนุฉ ุฌุฏูุฏุฉ (ุงูุงูุชุฑุงุถู ูฅูข)
Anchor window - ูู
ุดู
ุนุฉ ูุงุฎุฐ ู
ููุง ููุทุฉ ุงูุจุฏุงูุฉ (ูฃ)
ATR length/mult - ู
ููุงุณ ุงูู
ุณุงูุฉ (ูกูค ู ูฃ ุฃุถุนุงู)
Inner ratios - ุงูุฎุทูู ุงูุฑููุนูู (ู .ูฅ ู ู .ูฆูกูจ)
Cycle anchor - ู
ู ููู ุชุจุฏุฃ ุงูุฏูุฑุฉ: ู
ุน ุงูุฌูุณุฉุ ู
ุน ุงูุฃุณุจูุนุ ุฃู ูุฏูู
Display - ุฃููุงู ูุณู
ุงูุงุช ูุทูู ุงูุฎุทูุท ูุนุฏุฏ ุงูู
ุฌู
ูุนุงุช
ููุงู
ูุงุฒู
ูุชูุงู
ุงูู
ุคุดุฑ ูุนุทูู ู
ุณุชููุงุชุ ู
ู ุฅุดุงุฑุงุช ุฏุฎูู ูุฎุฑูุฌ. ูุฑุณู
ูู ุฏูุฑุฉ ุณูุงุก ุงูุณูู
ุชุฑูุฏ ุฃู ุนุฑุถูุ ูู
ุง ููู ููุชุฑ ูููู ูู ุงุฏุฎู ุงูุญูู. ุงุณุชุฎุฏู
ู ู
ุน ูุฑุงุกุชู ุฃูุช
ููุณูู.
ููุฐุง ู
ู ุชูุตูุฉ ุดุฑุงุก ููุง ุจูุน. ุฌุฑุจู ุนูู ุฃุฏูุงุชู ููุฑูู
ุงุชู ูุจู ูุง ุชุนุชู
ุฏ ุนููู ุจุตููุงุชู. Penunjuk

Auto Fibonacci AI - Level Respect Statistics [Dots3Red]๐ AUTO FIBONACCI AI - LEVEL RESPECT STATISTICS
Fibonacci retracement is one of the most widely used tools in trading. It is also one of the least verified. "The 0.618 is the golden pocket" gets repeated everywhere and tested nowhere. This script keeps score โ not universally, but specifically for the chart you are actually looking at.
โจ WHY THIS IS DIFFERENT
Every other Fibonacci tool draws the levels and stops there. Whether those levels actually work on this instrument, this timeframe, this market condition is left entirely to assumption. This script treats that as a question worth answering. Every touch of every level is graded: did price reject cleanly, or push through? The results accumulate directly in each level's label:
๐ 0.618 | 71% bounced (n=24)
That means: on this chart, at this timeframe, price has touched the 0.618 level 24 times across all the swings this script has processed. 71% of those touches resulted in a genuine rejection. 29% broke through. That is a real measurement, not a theoretical assumption.
โ๏ธ HOW IT WORKS
๐ Auto swing detection โ the script identifies the most recent confirmed pivot high and pivot low using a configurable lookback. A minimum swing size filter (in ATR units) rejects small, noisy movements โ only swings that represent genuine market structure anchor the Fibonacci grid. Swings are confirmed only on closed bars, so the anchor never changes retroactively.
๐ Retracement levels โ the standard five levels are drawn from the detected swing: 0.236, 0.382, 0.500, 0.618, and 0.786. The 0.618 is highlighted in amber since it receives the most attention from traders and institutions. Each level accumulates its own separate statistics.
๐ฏ Touch grading โ every time price approaches a level within a configurable tolerance, a touch is recorded and enters a pending state. Within the outcome window (configurable bars), it resolves as one of three outcomes:
โข Bounce โ price moved cleanly away from the level without breaking it
โข Break โ price closed convincingly through the level
โข Timeout โ neither happened clearly enough to call; counted as a touch but not a bounce or break
Each resolved touch feeds into that level's cumulative percentage โ and the labels update to show the live result.
๐ข Extension targets โ when price breaks past the swing's extreme (not just retracing to it but genuinely continuing through), the script activates two extension targets: 1.272 and 1.618. These are the levels most commonly used as continuation targets after a structural break. Each is tracked in its own way: did price actually reach 1.272 after the break? 1.618? Over time, the extension labels show:
๐ 1.272 | hit 64% (n=11)
๐ 1.618 | hit 41% (n=11)
That's a concrete answer to "how far does price usually go when it breaks the swing?" โ specific to this chart, not assumed from theory.
๐ Non-repainting โ pivots only confirm after the required bars on each side have closed. The swing anchor only updates when a new qualifying pivot is confirmed. Grading only happens on confirmed bars. The levels and statistics reflect what actually happened, not what the current bar is doing in real time.
๐งญ HOW TO USE
1๏ธโฃ Let the sample size build before trusting the percentages. A level that shows "0% bounced (n=2)" is meaningless โ two touches is noise. The labels deliberately show the N= count so you can judge reliability yourself. A consistent reading across 15+ touches is worth paying attention to; 3-5 touches is still developing.
2๏ธโฃ Compare across levels. If 0.382 shows 40% bounced on this chart while 0.618 shows 74% bounced, that's telling you something specific about which pullback depth this market tends to respect. That difference is invisible to a plain Fibonacci tool.
3๏ธโฃ Use extension hit rates for target selection. If 1.272 has been reached in 64% of breakout cases but 1.618 only in 41%, the first extension is the more realistic target on this chart โ and the second, while possible, has historically been hit less than half the time. This is not a rule; it is an observation about past behavior on this specific chart.
4๏ธโฃ Adjust settings to the timeframe. The defaults (pivot leg 8, minimum swing 3ร ATR) are calibrated for mid-range timeframes โ 15-minute through 4-hour โ where Fibonacci retracement is most actively watched by swing traders and where enough swings complete regularly to build meaningful sample counts. On faster timeframes, reduce both settings so smaller swings qualify. On slower ones, increase them to filter noise.
5๏ธโฃ The statistics describe the past, not the future. A high bounce rate at 0.618 means price has historically respected this level on this chart. It is not a promise that the current touch will also bounce. Use the percentages as context โ one input among many โ not as an automatic signal.
๐ ๏ธ SETTINGS
๐ Swing Detection
โข Pivot Leg โ bars required on each side to confirm a swing pivot
โข Min Swing Size โ smallest qualifying swing in ATR units; filters out noise
๐ฏ Level Grading
โข Touch Tolerance โ how close price must come to a level to count as a touch
โข Break Buffer โ how far past a level close must clear to grade as a break
โข Bounce Distance โ how far price must move away, cleanly, to grade as a bounce
โข Outcome Window โ bars allowed for a touch to resolve
โข Extension Window โ bars allowed for an extension target to be reached after a break
๐จ Visualization
โข Show Extension Targets โ toggle the 1.272 / 1.618 green lines
โข Per-Level Stat Labels โ toggle the bounce-rate text on each level
๐ฅ๏ธ Dashboard
โข Show / hide, position โ swing direction and per-level bounce rates in a compact table
๐ NOTES
The script tracks one active Fibonacci grid at a time โ the most recent qualifying swing. When a new swing confirms, the grid shifts and per-level statistics carry forward from all previous swings on the chart. The statistics are global across all swings processed since the indicator was added to the chart, not per-swing.
Statistics are most meaningful on timeframes where Fibonacci retracement is genuinely watched and defended by real market participants โ typically 15-minute through 4-hour. Very short timeframes will accumulate sample counts quickly but the measurements may reflect microstructure noise rather than true level respect. Very long timeframes will take extended real-world time to build enough data to be informative.
โ ๏ธ DISCLAIMER
This is an analytical and visualization tool. It does not generate trade signals and does not constitute financial advice. Historical bounce and hit rates do not guarantee how price will behave at any specific future level touch. Penunjuk

Fibonacci Trend Continuation Signals [AlgoAlpha]๐ OVERVIEW
Fibonacci Trend Continuation Signals maps Fibonacci retracement levels inside an adaptive trend structure. It combines a smoothed price midline, volatility-based outer bands, and Fibonacci ratios to show where price is trading within the current bullish or bearish trend range.
The trend changes only when price moves beyond a volatility-adjusted outer band. Once a direction is active, the script projects 0.236, 0.382, 0.500, 0.618, and 0.786 levels between the active outer band and the midline. This creates a moving Fibonacci framework that adjusts as price and volatility change.
Continuation signals appear when price closes back through an enabled Fibonacci level in the direction of the active trend. This lets traders use retracements within an established trend instead of treating each Fibonacci level as a fixed reversal point.
๐ CONCEPTS
Trend Midline โ An exponential moving average of closing price. It forms the central reference for the trend structure and the endpoint of the Fibonacci range.
Volatility Bands โ Outer boundaries placed above and below the midline using a smoothed measure of the high-to-low price range. Price crossing an outer band changes the active trend direction.
Fibonacci Trend Range โ The distance between the active outer band and the midline. In bullish trends, levels are measured upward from the lower band. In bearish trends, they are measured downward from the upper band.
Fibonacci Levels โ The 0.236, 0.382, 0.500, 0.618, and 0.786 ratios divide the active trend range into retracement zones that move with the underlying trend structure.
Continuation Signal โ A bullish signal occurs when price closes upward through an enabled Fibonacci level during a bullish trend. A bearish signal occurs when price closes downward through an enabled Fibonacci level during a bearish trend.
๐ FEATURES
Adaptive Fibonacci Profile โ Displays five configurable Fibonacci levels between the active volatility band and trend midline.
Trend Continuation Signals โ Shows bullish and bearish markers when price closes through an enabled Fibonacci level in the direction of the active trend.
Current Level Labels โ Shows the current price value of each enabled Fibonacci level at the latest bar.
Trend Change Markers โ Marks the Fibonacci structure when a new bullish or bearish trend begins.
๐ HOW TO USE
Identify the active trend structure โ A bullish structure projects Fibonacci levels from the lower band toward the midline, while a bearish structure projects them from the upper band toward the midline.
Watch price during a retracement โ Use the displayed Fibonacci zones to see how far price has moved through the active trend range.
Look for continuation signals โ An upward triangle shows that price crossed above an enabled Fibonacci level during a bullish trend. A downward triangle shows the equivalent bearish close below a level.
Compare signals with price structure โ Use nearby swing points, support, resistance, or your existing confirmation method before acting on a continuation signal.
Adjust Midline Length, Pivot Length, and Band Width to control how quickly the trend framework responds to price and how wide its outer boundaries are.
Enable or disable individual Fibonacci levels to keep only the retracement levels relevant to your method.
๐ CONCLUSION
Fibonacci Trend Continuation Signals combines volatility-based trend detection with adaptive Fibonacci retracement levels and directional continuation signals. It gives traders a moving reference for measuring pullbacks and identifying closes that resume movement in the active trend direction. Penunjuk

ADX/DI Profile & Volume Footprint๐ถOverview
This script merges two powerful analytical frameworksโ"Algorithmic ADX/DI Price Profile" and "High-Precision Volume Footprint"โinto a single chart overlay. By moving Directional Movement data from the time axis (X-axis) to the price axis (Y-axis) and scanning lower timeframe (LTF) tick arrays, it accurately visualizes where trend energy is concentrated and how buyers and sellers interact at discrete price levels. This allows you to objectively verify market structure before committing capital.
๐ถSystem Modules and Execution Flow
Volume Footprint Engine: Utilizes request.security_lower_tf() to scan up to 50 historical bars on a lower timeframe (down to 1-second for Premium users) to reconstruct intra-bar order flow. : Toggle between "Individual Bars" mode for per-candle footprints, and "Composite (N Bars)" mode to aggregate order flow over a specified range into a single comprehensive structure.
ADX/DI Profile Matrix: Computes standard 14-period DMI components, scalable via a Multi-Timeframe (MTF) engine. Generates fixed bounding boxes over historical sessions to project +DI, -DI, and ADX intensity as horizontal histograms. : Profiles are visually separated (Left, Right, Center aligned). A real-time heatmap shader shifts from "Cold" to "Hot" based on energy concentration, instantly identifying trend exhaustion or accumulation zones.
Local VWAP & Fibonacci Controller: Using the dynamically calculated profile range as an anchor, it draws a local Volume Weighted Average Price (VWAP) and customizable Fibonacci extensions, providing highly logical stop-loss and take-profit targets.
Analytical HUD (Default OFF): A fixed 50-column matrix table dynamically tracks Delta, Total Volume, Total Buy, and Total Sell orders, eliminating the need to manually decipher individual numbers inside the boxes.
๐ถConfiguration and Filtering Options
Resolution & Boundaries: Defines profile row counts (10 to 50 tiers; max 40 recommended for perfect stability, though this does not apply to line rendering) and width multipliers. When trading highly volatile assets like crypto or indices, reducing this to 30 thickens the price buckets and improves visibility.
Algorithmic Noise Filter: A critical threshold gate (0.0 to 1.0). Price tiers failing to meet this relative intensity ratio are visually muted. Increasing the default 0.08 to 0.15 (15%) mathematically erases low-impact price zones, leaving only institutional-level support/resistance clusters.
Volume Weight Toggle: An option to fuse volume data into DMI calculations. Prioritizes directional moves backed by real capital over empty price spikes.
Premium Seconds-Timeframe Guard: An automated downgrade protocol to ensure script stability. If a non-Premium plan is detected, it automatically converts 1-second (1S) requests to a 1-minute timeframe to prevent fatal array compilation errors.
๐ถTrading Strategy and Practical Applications
"Wait & See" Filter (Avoiding Chop): The system's color shader acts as your first gate of discipline. If the ADX profile (center) shows "Cold" colors (e.g., dark orange/amber), it means trend energy is low. Do not trade; remain in a no-position state until the ADX blocks turn "Hot" (bright yellow), confirming massive algorithmic participation.
Absorption and Exhaustion Setups: Watch the Footprint engine boxes drawn over the candles closely. If a massive spike of aggressive buying (high positive delta, green text) occurs, yet the candle fails to break out and is immediately capped by a dense -DI profile block (right side, Hot Red), this is "Absorption." Buyers are trapped. Enter short right below this Point of Control (POC) with a tight stop-loss just above the profile box.
VWAP / Fibonacci Targeting: Once an entry is validated by Footprint delta, use the dynamically plotted VWAP as a baseline. For longs, target the upper Fibonacci bands (0.618 or 1.000). The beauty of this system is that these bands are derived strictly from the profiled session's "volume", reacting mathematically to the current market environment rather than arbitrary historical swings.
๐ถArchitecture and Quantitative Logic (Code Breakdown)
This script relies on multiple mathematical matrices to transform time-based indicators into price-based structures.
1. Footprint Volume Distribution (Tick Estimation)
ticks_1s = math.round((c_h - c_l) / syminfo.mintick) + 1
v_tick = c_v / ticks_1s
Why this calculation is performed: TradingView cannot provide sub-second Bid/Ask data. To measure aggressive market participation at specific price levels and objectively distinguish local buying absorption from selling pressure, the engine mathematically divides the lower timeframe bar's spread (High - Low) and distributes volume evenly across each tick to synthesize aggressive trading behavior.
Actual Output Value: A raw Float representing estimated volume at a single price tick. For example, if a 1-second volume (c_v) is 100 contracts and the spread covers 5 ticks, the output (v_tick) is exactly 20.0 per tick. Absolute volumes are formatted as strings (e.g., "1.5K") for the UI, while net delta is output to the HUD summary table as raw positive/negative floats.
2. DMI Profile Allocation and Normalization
net_di_ratio = math.abs(raw_p_plus - raw_p_minus) / (raw_p_plus + raw_p_minus)
p_plus = raw_p_plus * c_vol * (1 + net_di_ratio)
Why this calculation is performed: To pinpoint the exact price nodes where trend strength (ADX) and direction (+DI/-DI) physically occurred, filtering out empty volatility. Standard DMI ignores volume; this script multiplies DI intensity by trading volume (c_vol) and scales it via net_di_ratio to highlight zones where one side completely overwhelmed the other.
Actual Output Value: A large integer/float representing the local energy assigned to that price tier. If raw +DI is 30, raw -DI is 10, and volume is 1,000, the net_di_ratio is 20 / 40 = 0.5. The final p_plus output assigned to that tier is 30 * 1000 * 1.5 = 45,000 energy points.
3. Box Scaling and Noise Filter
ratio_plus = val_plus / max_plus
// If ratio_plus >= noise_filter, render the box
Why this calculation is performed: To eliminate market noise. max_plus is the Point of Control (POC)โthe price tier with the absolute maximum energy. All other tiers are divided by this maximum to output a percentage (0.0 to 1.0). The noise filter (default 0.08, or 8%) culls tiers holding less than 8% of the POC's intensity.
Actual Output Value: A Float ratio between 0.0 and 1.0. A tier with 22,500 energy against a POC of 45,000 outputs 0.5. This 0.5 is passed directly to the f_get_heatmap_color function, outputting an RGBA hex color code that dynamically blends "Cold" and "Hot" variables based on intensity.
4. VWAP and Geometric Fibonacci Derivation
Why this calculation is performed: To establish a baseline fair value and logical standard deviation bands derived directly from the profiled session's volume distribution.
Actual Output Value: Exact absolute price coordinates (Y-axis floats). The Local VWAP is calculated by dividing the sum of (Typical Price * Volume) by Total Volume within the profile window. Fibonacci levels are output as the absolute distance from the VWAP to the session high/low multiplied by standard ratios (0.382, 0.618, 1.000). These are mapped as solid, dashed, or dotted lines across the X-axis bounds of the profile box.
๐ถCapabilities and Limitations
Capabilities: Synthesizes massive LTF data arrays into clean, readable UI boxes without repainting. Modular layout prevents candlesticks from being obscured.
Limitations: TradingView imposes strict limits of 500 boxes, 500 lines, and 500 labels per script. On highly volatile assets with deep tick resolution, maximizing row_count or setting footprint lookbacks to 50 bars may cause older UI elements to clip (disappear) due to platform-level garbage collection constraints.
Penunjuk

3x MTF MA Zones [josseliani]3x MTF MA Zones is a clean multi-timeframe moving average overlay designed for dynamic support/resistance, trend structure and higher-timeframe context.
The indicator combines up to three independently configurable moving averages in one chart overlay. Each MA can use its own type, length, source and timeframe, allowing higher-timeframe moving average structure to be displayed directly on a lower-timeframe chart.
In addition to the three MAs, the indicator can identify the directional relationship between the two longer moving averages and visually highlight changes in that structure.
Three Independent Moving Averages
Each MA can be configured separately.
Available settings include:
MA type: EMA, SMA, WMA or SMMA
Source
Length
Timeframe
Color
Line width
Visibility
The default configuration uses SMMA 50 / 100 / 200.
If the timeframe field is left empty, the MA is calculated using the current chart timeframe.
A different timeframe can be selected independently for each MA. For example, a trader working on a 1-minute chart can display moving averages calculated from the 5-minute or 15-minute timeframe without changing charts.
Confirmed Higher-Timeframe Values
The optional Use Confirmed HTF Values setting controls how higher-timeframe moving averages are displayed.
When enabled, the indicator uses the last completed higher-timeframe MA value. This keeps the higher-timeframe structure stable while the current higher-timeframe candle is still developing.
When disabled, the currently developing higher-timeframe MA value can be displayed instead.
MA Zones
Optional fills can be displayed between:
MA 1 and MA 2
MA 2 and MA 3
This allows nearby moving averages to be viewed as broader dynamic structure zones rather than only as individual lines.
These areas can be useful for observing pullbacks, price reactions and confluence between several moving averages.
MA Cross and Trend Context
The indicator also monitors the relationship between the displayed moving averages.
When all three MAs are visible, the two MAs with the longest selected periods are used for the cross analysis.
If only two MAs are visible, those two are used instead.
A confirmed crossover between the selected pair changes the current directional state:
Green background โ bullish MA structure
Red background โ bearish MA structure
The background remains active until an opposite crossover changes the directional state.
The crossover itself can also be marked with a small diamond and an optional vertical divider through the chart.
These elements are intended to make changes in the broader MA structure easy to identify without adding separate indicators to the chart.
How I Use It
I mainly use 3x MTF MA Zones to keep higher-timeframe structure visible while trading lower timeframes.
One configuration I use for intraday gold scalping is 5-minute SMMA 50 / 100 / 200 displayed on a 1-minute chart.
I use the moving averages and the areas around them as possible:
trend-structure zones
dynamic support and resistance
reaction areas
pullback areas
continuation levels
higher-timeframe confluence
The background gives an additional visual reference for the current relationship between the longer moving averages.
This is only an example of my own configuration. The MA types, periods and timeframes can be adapted to different markets and trading styles.
Alerts
The indicator includes two types of alerts.
MA Touch Alerts
Each of the three moving averages has an independent touch alert.
A touch is detected when price reaches the corresponding MA. Each MA also has its own cooldown setting to help prevent repeated notifications while price is consolidating around the same level.
MA Cross Alerts
Separate bullish and bearish alerts are available when the selected MA pair crosses and the directional state changes.
This makes it possible to receive notifications both when price reaches an MA area and when the broader moving-average structure changes.
What Makes 3x MTF MA Zones Different
The purpose of 3x MTF MA Zones is to combine several related parts of moving-average analysis in one compact overlay.
Instead of using several separate MA indicators, each moving average can be configured independently with its own type, source, period and timeframe.
The indicator then combines these MAs with optional structure zones, confirmed higher-timeframe values, automatic cross analysis of the relevant longer-period MAs, visual trend-state highlighting and independent touch and crossover alerts.
The result is a simple multi-timeframe structure map that can remain on the trading chart without requiring constant switching between timeframes.
Notes
3x MTF MA Zones does not generate automatic buy or sell signals.
The green and red background represents the directional relationship between the selected moving averages after a confirmed crossover. It should not be interpreted as an automatic instruction to enter a trade.
Moving averages are based on historical price data, and interaction with an MA or MA zone does not guarantee support, resistance, continuation or reversal.
The indicator is intended as a visual market-structure and planning tool and should be combined with the user's own analysis and risk-management process. Penunjuk

Support and Resistance Zones, Key Levels & Hold Rate [LunqFX]Support and resistance indicators all draw the same picture: a set of key levels and SR zones detected from swing pivots, every one of them looking as important as the next. Five price levels on the chart and no way to tell which one the market actually respects โ so you place the order at whichever support or resistance price bounced off last, and call it analysis.
This support and resistance indicator keeps score. Each auto-detected SR zone carries the number of times it has been tested and how many of those tests it held, printed on the level itself:
1.15370 ยท 71% ยท 5 of 7 1.14344 ยท 50% ยท 1 of 2 1.13763 ยท 67% ยท 2 of 3
A key level that has held five of seven tests and one that has held one of six are not the same object, and until that number is on the chart you are trading them as if they were.
Included: automatic support and resistance zone detection from confirmed pivots, a hold-rate record on every level, strength-weighted drawing, a dashboard showing the nearest support and resistance either side of price, and optional buy and sell signals with a trend filter and alerts.
โถ HOW THE SUPPORT AND RESISTANCE ZONES ARE BUILT
Swing points come from confirmed pivots, so a level only exists once the bars on both sides of it have closed โ nothing appears and then vanishes. Pivots that land close to each other are merged into a single zone rather than stacked as near-duplicate lines, with the merge distance measured in ATR so it adapts to the instrument.
A zone widens as new pivots join it, but only up to a ceiling. Past that it re-centres on the pivot that just touched it. Without that rule a level slowly swallows everything around it and turns into a band, and the count then measures touches of a band instead of touches of a price.
โท THE HOLD RATE โ what no other support and resistance tool shows
A test opens when price trades into the zone. It resolves on a CLOSED bar, one of two ways:
โธ HELD โ price closed back out the side it came from, clear of the zone by a fraction of ATR. The margin matters: without it, a close one tick beyond the edge counts as a rejection, which is how level indicators manufacture events out of noise. โธ BROKEN โ price closed through to the other side.
Nothing is counted while a test is still open. And a fresh test cannot begin until the previous one has had room to breathe, because price chopping inside a zone for a week is one consolidation, not twenty separate tests of the level.
Samples of fewer than four tests are marked with a tilde. Two tests producing "100%" is noise, and the chart says so rather than letting the number stand.
โธ LEVEL STRENGTH YOU CAN SEE
Fill density, border thickness and the halo behind each zone all scale with how often the level has been tested, and levels holding above 60% are drawn in a brighter shade. The chart ranks its own levels โ the strongest one is the one that looks strongest, with no arithmetic required from you.
โน THE DASHBOARD โ nearest support and resistance
The nearest level above and the nearest level below, each with its price and its record. When there is no tracked level on one side the panel says exactly that, rather than printing a dash that reads like a fault.
โบ BUY AND SELL SIGNALS โ built in, switched off
The indicator includes buy and sell signals: a buy label when a support test holds, a sell label when resistance holds. Turn them on in the Signals section โ the switch is the first setting in the group, and every alert works from them.
They ship switched OFF, and the reason is worth stating plainly. A rejection at a support or resistance level is a fact. What price does afterwards is not. A level also tends to weaken with each test as the orders behind it are consumed, so "this level held four times" is not evidence that it will hold a fifth โ if anything the reverse. Any indicator that hands you an arrow on every bounce is selling you that assumption without saying so.
When switched on, a signal has to clear six filters before it prints: the level must have been tested enough times to have a record, it must hold more often than it breaks, the rejection must close clear of the zone by a fraction of ATR, price must still be near the level, the trend must agree with the direction, and both the chart as a whole and that particular level must have been quiet since the last one. Set that way they are rare. Treat them as a prompt to look, not as a call to act.
HOW TO USE IT
1 โ Choose where to place a resting order. Between two levels the same distance away, the one with the better record is the better limit.
2 โ Choose where to expect a break. A level holding one test in six is telling you something too: price is likely to go through it, which makes it a poor place to fade and a reasonable place to trade a breakout.
3 โ Place stops behind proven levels. A stop tucked behind a level that has held five of seven has a structural reason to be there.
4 โ Read the whole set at once. This is the reading most traders never get. If every level on the chart is showing 30โ40%, the market is not respecting levels at all right now โ it is trending or reacting to news, and level trading is the wrong approach for the session. When most levels sit at 70%+, the market is rotating and levels are worth trading. That judgement usually takes weeks of screen time; here it is on the chart.
HOW IT WORKS
Pivots of your chosen length define candidate levels. Each new pivot either joins the nearest existing zone within the merge distance or opens a new one; zones are capped in width and the oldest is dropped once the limit is reached. Every zone tracks four numbers: tests, holds, the bar its last test resolved on, and the bar it last signalled on. Tests resolve on closed bars only, with a rejection margin in ATR and a minimum gap between tests. The hold rate is simply holds divided by tests, and the drawing weight is derived from the test count.
Works on any symbol and timeframe. On daily charts and above, leave the minimum test count at one โ a level there rarely gets a second test before it matters. On fast intraday charts raise it, since levels are tested often.
SETTINGS
โธ Levels โ pivot length, how many levels are kept, how far back they draw, merge distance, zone thickness, maximum width, minimum tests to draw, and the gap between tests. โธ Signals โ off by default; prior holds required, minimum tests before a level may speak, minimum hold rate, cooldowns, distance from price and rejection strength. โธ Trend Filter โ direction requires both price position and the slope of the average, so a range satisfies neither side. โธ Visuals โ extension, labels, candle colouring, dashboard position.
ALERTS โ buy signal, sell signal, and any signal. All fire on closed bars only.
NON-REPAINTING โ levels are built from confirmed pivots and every test resolves on a closed bar. A record that has printed never changes retroactively, and a level that has appeared never disappears from history.
WHY THESE PARTS ARE ONE SCRIPT
The levels, the record and the visual weight describe one object. Detection alone gives you lines with no way to rank them. The record alone has nothing to attach itself to. The weighting exists only so the record can be read at a glance instead of counted. Take any one away and the other two stop being useful, which is why they ship together rather than as three indicators.
This indicator is an educational market-analysis tool, not financial advice. The hold rate describes what has already happened at a level on the loaded chart; it does not predict what will happen next. Always confirm with your own analysis and manage your risk. Penunjuk

Sattam Supply | DemandSATTAM Supply | Demand Zones (Multi-Timeframe)
OVERVIEW
This indicator maps supply and demand zones from a timeframe you choose and draws them on your current chart. Instead of marking every swing point, it only accepts a swing that is followed by a genuine displacement move away from that level, measured against volatility (ATR). The goal is a chart with a small number of meaningful zones rather than dozens of overlapping boxes. Zones are drawn as boxes with a 50% midline, extended to the right until price invalidates them.
HOW A ZONE IS CREATED
A zone is created in two stages.
1) Pivot detection
The script looks for a pivot high (for supply) or a pivot low (for demand) on the selected timeframe. A pivot needs "Pivot Length" bars on each side to confirm, so the swing is a completed structural turning point and not a temporary extreme.
2) Displacement confirmation
A confirmed pivot is not enough on its own. After the pivot confirms, the script watches the next few bars ("Displacement Window") for a decisive close away from the level:
- Supply: a close below the pivot candle's low by more than ATR(14) x displacement factor
- Demand: a close above the pivot candle's high by more than ATR(14) x displacement factor
The ATR value used is the one captured at the pivot bar itself, so the confirmation threshold reflects the volatility that existed when the level formed, not the volatility at the moment of the breakout. If no qualifying close appears inside the window, the pivot is discarded and no zone is drawn.
The displacement factor is derived from the "Sensitivity" input: max(0.10, 1.15 - Sensitivity x 0.10). Higher sensitivity means a smaller required move, which produces more zones. Lower sensitivity demands a stronger reaction and produces fewer, more selective zones.
ZONE BOUNDARIES
Each zone is anchored at the pivot candle's own time, so the box starts where the level actually formed.
- Supply: the top is the pivot high, the bottom is the pivot candle's body top, min(open, close).
- Demand: the bottom is the pivot low, the top is the pivot candle's body bottom, max(open, close).
If that body-to-wick distance is unusually thin, the height is expanded to a volatility-based minimum (ATR at the pivot x width factor) so the zone stays usable on quiet candles. The "Width" input scales that minimum.
ZONE MANAGEMENT
Overlap filter: a new zone is rejected if it overlaps an existing zone by more than 45% of the smaller zone's height, or if it forms close in time with a nearly identical midpoint. This prevents clusters of near-duplicate boxes around the same level.
Zone limit: "Max Zones Per Side" caps how many supply and demand zones stay on the chart. When the limit is reached, the oldest zone is removed.
Invalidation: with "Hide Invalidated Zones" enabled, a supply zone is deleted after a close above its top and a demand zone after a close below its bottom. Disable it to keep broken zones visible for context.
Extension: active zones extend to the right by "Zones Offset" bars of the current chart so they stay visible ahead of price.
REPAINTING
Zones are committed only from closed bars of the selected timeframe. When a new higher-timeframe bar opens, the script reads the signal produced by the bar that just closed, and request.security is called with lookahead_off. A zone that has been drawn will not move or disappear on a later refresh, and no zone appears from a still-forming higher-timeframe bar.
Because of this, a zone always appears with a delay of at least "Pivot Length" bars plus the displacement bars on the selected timeframe. That delay is inherent to pivot-based confirmation.
SETTINGS
Source
- Timeframe: the timeframe the zones are calculated from (default 4H). Leave empty to use the chart timeframe.
- Pivot Length: bars required on each side of a swing for it to count as a pivot.
- Sensitivity: 1 to 10. Higher values loosen the displacement filter and allow more zones.
- Displacement Window: how many bars after a pivot confirms the script keeps waiting for a displacement close before discarding the pivot.
Zones
- Width: scales the volatility-based minimum zone thickness.
- Zones Offset: how far zones extend to the right.
- Max Zones Per Side: maximum simultaneous supply and demand zones.
- Hide Invalidated Zones: remove zones after price closes through them.
Style : fill and border colors for supply and demand, plus midline style (dashed, dotted, solid).
Timeframe Label : an on-chart label showing which timeframe the zones come from, with position, size and color options.
HOW TO USE IT
Set the Timeframe higher than your chart timeframe, for example 4H zones on a 15m chart, so you keep a structural reference while working on a lower timeframe. Zones mark areas where an imbalance formed and price left the level quickly. They are areas of interest for observing price behaviour, not signals in themselves.
Reduce Sensitivity and raise Pivot Length on noisy or lower timeframes if too many zones appear. Raise Sensitivity on higher timeframes or slow instruments if too few appear.
ALERTS
Two alert conditions are available: New Supply Zone and New Demand Zone. Both fire when a zone is confirmed from a closed higher-timeframe bar.
NOTES AND LIMITATIONS
- The indicator describes structure that has already formed. It does not predict direction and produces no buy or sell signals.
- Zone quality depends on the selected timeframe and instrument. Settings that work on one market will not automatically suit another.
- Very illiquid symbols or timeframes with wide gaps may produce fewer valid displacement confirmations.
This script is published for educational and analytical purposes only. It is not financial advice and does not guarantee any result. Always test any tool on your own instruments and timeframes before relying on it.
ู
ุคุดุฑ ู
ูุงุทู ุงูุนุฑุถ ูุงูุทูุจ - ู
ุชุนุฏุฏ ุงููุฑูู
ุงุช
ูุธุฑุฉ ุนุงู
ุฉ
ูุฑุณู
ุงูู
ุคุดุฑ ู
ูุงุทู ุงูุนุฑุถ ูุงูุทูุจ ู
ู ูุฑูู
ุชุฎุชุงุฑู ุฃูุช ููุนุฑุถูุง ุนูู ุงูุดุงุฑุช ุงูุญุงูู. ุจุฏูุงู ู
ู ุชุนููู
ูู ูู
ุฉ ููุงุนุ ูุง ููุจู ุงูู
ุคุดุฑ ุงูุณูููู ุฅูุง ุฅุฐุง ุชุจุนุชู ุญุฑูุฉ ุงูุฏูุงุน ุญููููุฉ ุจุนูุฏุงู ุนู ุงูู
ุณุชููุ ุชููุงุณ ูุณุจุฉู ุฅูู ุชุฐุจุฐุจ ุงูุณูู ุนุจุฑ ATR. ุงููุฏู ุดุงุฑุช ููู ุนุฏุฏ ูููู ู
ู ุงูู
ูุงุทู ุงูู
ูู
ุฉ ุจุฏู ุนุดุฑุงุช ุงูุตูุงุฏูู ุงูู
ุชุฏุงุฎูุฉ. ุชูุฑุณู
ุงูู
ูุทูุฉ ุนูู ุดูู ุตูุฏูู ู
ุน ุฎุท ู
ูุชุตู ุนูุฏ 50% ููู
ุชุฏ ูููู
ูู ุญุชู ููุจุทูู ุงูุณุนุฑ.
ููู ุชุชูููู ุงูู
ูุทูุฉ
ุงูู
ุฑุญูุฉ ุงูุฃููู: ุงูุจุญุซ ุนู ูู
ุฉ ุจูููุช ููุนุฑุถ ุฃู ูุงุน ุจูููุช ููุทูุจ ุนูู ุงููุฑูู
ุงูู
ุฎุชุงุฑ. ูุญุชุงุฌ ุงูุจูููุช ุฅูู ุนุฏุฏ ุงูุดู
ูุน ุงูู
ุญุฏุฏ ูู Pivot Length ุนูู ูู ุฌุงูุจ ุญุชู ูุชุฃูุฏุ ุญุชู ูููู ููุทุฉ ุงูุนูุงุณ ุจููููุฉ ู
ูุชู
ูุฉ ูุง ู
ุฌุฑุฏ ุทุฑู ู
ุคูุช.
ุงูู
ุฑุญูุฉ ุงูุซุงููุฉ: ุงูุจูููุช ูุญุฏู ูุง ูููู. ุจุนุฏ ุชุฃูุฏู ูุฑุงูุจ ุงูู
ุคุดุฑ ุงูุดู
ูุน ุงูุชุงููุฉ ุฎูุงู Displacement Window ุจุญุซุงู ุนู ุฅุบูุงู ุญุงุณู
ุจุนูุฏุงู ุนู ุงูู
ุณุชูู:
- ุงูุนุฑุถ: ุฅุบูุงู ุฃุณูู ูุงุน ุดู
ุนุฉ ุงูุจูููุช ุจู
ุณุงูุฉ ุฃูุจุฑ ู
ู ATR(14) ู
ุถุฑูุจุงู ูู ู
ุนุงู
ู ุงูุงูุฏูุงุน.
- ุงูุทูุจ: ุฅุบูุงู ุฃุนูู ูู
ุฉ ุดู
ุนุฉ ุงูุจูููุช ุจู
ุณุงูุฉ ุฃูุจุฑ ู
ู ATR(14) ู
ุถุฑูุจุงู ูู ู
ุนุงู
ู ุงูุงูุฏูุงุน.
ููู
ุฉ ATR ุงูู
ุณุชุฎุฏู
ุฉ ูู ุงูููู
ุฉ ุงูู
ุณุฌููุฉ ุนูุฏ ุดู
ุนุฉ ุงูุจูููุช ููุณูุงุ ุฃู ุฃู ุญุฏ ุงูุชุฃููุฏ ูุนูุณ ุงูุชุฐุจุฐุจ ุงูุฐู ูุงู ูุงุฆู
ุงู ููุช ุชูููู ุงูู
ุณุชูู ูุง ููุช ุงูุงุฎุชุฑุงู. ูุฅุฐุง ูู
ูุธูุฑ ุฅุบูุงู ู
ุคููู ุฏุงุฎู ุงููุงูุฐุฉ ูููุบู ุงูุจูููุช ููุง ุชูุฑุณู
ู
ูุทูุฉ.
ู
ุนุงู
ู ุงูุงูุฏูุงุน ู
ุดุชู ู
ู ุฅุฏุฎุงู Sensitivity ุจุงูู
ุนุงุฏูุฉ: max(0.10, 1.15 - Sensitivity x 0.10). ููู
ุง ุงุฑุชูุนุช ุงูุญุณุงุณูุฉ ูููุช ุงูู
ุณุงูุฉ ุงูู
ุทููุจุฉ ูุฒุงุฏ ุนุฏุฏ ุงูู
ูุงุทูุ ูููู
ุง ุงูุฎูุถุช ุชุทููุจ ุงูู
ุคุดุฑ ุฑุฏ ูุนู ุฃููู ูุฃุนุทู ู
ูุงุทู ุฃูู ูุฃูุซุฑ ุงูุชูุงุฆูุฉ.
ุญุฏูุฏ ุงูู
ูุทูุฉ
ุงูู
ูุทูุฉ ู
ุซุจูุชุฉ ุนูู ููุช ุดู
ุนุฉ ุงูุจูููุช ููุณูุงุ ููุจุฏุฃ ุงูุตูุฏูู ู
ู ุญูุซ ุชูููู ุงูู
ุณุชูู ูุนูุงู.
- ุงูุนุฑุถ: ุงููู
ุฉ ูู ูู
ุฉ ุงูุจูููุชุ ูุงููุงุน ูู ุฃุนูู ุฌุณู
ุงูุดู
ุนุฉ ุฃู min(open, close).
- ุงูุทูุจ: ุงููุงุน ูู ูุงุน ุงูุจูููุชุ ูุงููู
ุฉ ูู ุฃุณูู ุฌุณู
ุงูุดู
ุนุฉ ุฃู max(open, close).
ูุฅุฐุง ูุงูุช ูุฐู ุงูู
ุณุงูุฉ ุฑููุนุฉ ุจุดูู ุบูุฑ ู
ุนุชุงุฏ ูููุณููุน ุงูุงุฑุชูุงุน ุฅูู ุญุฏ ุฃุฏูู ู
ุจูู ุนูู ATR ุนูุฏ ุงูุจูููุช ู
ุถุฑูุจุงู ูู ู
ุนุงู
ู ุงูุนุฑุถุ ุญุชู ุชุจูู ุงูู
ูุทูุฉ ูุงุจูุฉ ููุงุณุชุฎุฏุงู
ุนูู ุงูุดู
ูุน ุงููุงุฏุฆุฉ. ููุชุญูู
ุฅุฏุฎุงู Width ูู ูุฐุง ุงูุญุฏ ุงูุฃุฏูู.
ุฅุฏุงุฑุฉ ุงูู
ูุงุทู
ููุชุฑ ุงูุชุฏุงุฎู: ุชูุฑูุถ ุฃู ู
ูุทูุฉ ุฌุฏูุฏุฉ ุชุชุฏุงุฎู ู
ุน ู
ูุทูุฉ ูุงุฆู
ุฉ ุจุฃูุซุฑ ู
ู 45% ู
ู ุงุฑุชูุงุน ุงูุฃุตุบุฑ ุจูููู
ุงุ ุฃู ุชุชูููู ูุฑูุจุงู ู
ููุง ุฒู
ููุงู ุจู
ูุชุตู ุดุจู ู
ุทุงุจู. ูุฐุง ูู
ูุน ุชุฑุงูู
ุตูุงุฏูู ุดุจู ู
ูุฑุฑุฉ ุญูู ุงูู
ุณุชูู ููุณู.
ุญุฏ ุงูู
ูุงุทู: ูุญุฏูุฏ Max Zones Per Side ุฃูุตู ุนุฏุฏ ููู
ูุงุทู ุนูู ูู ุฌูุฉุ ูุชูุญุฐู ุงูุฃูุฏู
ุนูุฏ ุชุฌุงูุฒ ุงูุญุฏ.
ุงูุฅุจุทุงู: ู
ุน ุชูุนูู Hide Invalidated Zones ุชูุญุฐู ู
ูุทูุฉ ุงูุนุฑุถ ุจุนุฏ ุฅุบูุงู ููู ูู
ุชูุงุ ูู
ูุทูุฉ ุงูุทูุจ ุจุนุฏ ุฅุบูุงู ุชุญุช ูุงุนูุง. ููู
ูู ุชุนุทููู ููุฅุจูุงุก ุนูู ุงูู
ูุงุทู ุงูู
ูุณูุฑุฉ ูุณูุงู.
ุงูุงู
ุชุฏุงุฏ: ุชู
ุชุฏ ุงูู
ูุงุทู ุงููุดุทุฉ ูููู
ูู ุจู
ูุฏุงุฑ Zones Offset ู
ู ุดู
ูุน ุงูุดุงุฑุช ุงูุญุงูู ูุชุจูู ุธุงูุฑุฉ ุฃู
ุงู
ุงูุณุนุฑ.
ุฅุนุงุฏุฉ ุงูุฑุณู
ุชูุนุชู
ุฏ ุงูู
ูุงุทู ู
ู ุงูุดู
ูุน ุงูู
ุบููุฉ ููุท ุนูู ุงููุฑูู
ุงูู
ุฎุชุงุฑ. ุนูุฏ ูุชุญ ุดู
ุนุฉ ุฌุฏูุฏุฉ ุนูู ุงููุฑูู
ุงูุฃุนูู ููุฑุฃ ุงูู
ุคุดุฑ ุงูุฅุดุงุฑุฉ ุงููุงุชุฌุฉ ุนู ุงูุดู
ุนุฉ ุงูุชู ุฃูุบููุช ููุชูุ ูุชูุณุชุฏุนู request.security ุจุฎูุงุฑ lookahead_off. ูุฐูู ุงูู
ูุทูุฉ ุจุนุฏ ุธููุฑูุง ูุง ุชุชุญุฑู ููุง ุชุฎุชูู ุนูุฏ ุงูุชุญุฏูุซุ ููุง ุชุธูุฑ ุฃู ู
ูุทูุฉ ู
ู ุดู
ุนุฉ ูู
ุชูุบูู ุจุนุฏ.
ููุชูุฌุฉ ูุฐูู ุชุธูุฑ ุงูู
ูุทูุฉ ู
ุชุฃุฎุฑุฉ ุจู
ูุฏุงุฑ ุดู
ูุน ุงูุจูููุช ุฒุงุฆุฏ ุดู
ูุน ุงูุงูุฏูุงุน ุนูู ุงููุฑูู
ุงูู
ุฎุชุงุฑุ ููู ุชุฃุฎูุฑ ู
ูุงุฒู
ูุฃู ุชุฃููุฏ ู
ุจูู ุนูู ุงูุจูููุช.
ุงูุฅุนุฏุงุฏุงุช
ุงูู
ุตุฏุฑ
- Timeframe: ุงููุฑูู
ุงูุฐู ุชูุญุณุจ ู
ูู ุงูู
ูุงุทูุ ูุงูุงูุชุฑุงุถู 4 ุณุงุนุงุช. ุงุชุฑูู ูุงุฑุบุงู ูุงุณุชุฎุฏุงู
ูุฑูู
ุงูุดุงุฑุช.
- Pivot Length: ุนุฏุฏ ุงูุดู
ูุน ุงูู
ุทููุจุฉ ุนูู ูู ุฌุงูุจ ูุงุนุชู
ุงุฏ ุงูุจูููุช.
- Sensitivity: ู
ู 1 ุฅูู 10ุ ูุงูููู
ุงูุฃุนูู ุชุฎูู ููุชุฑ ุงูุงูุฏูุงุน ูุชุณู
ุญ ุจู
ูุงุทู ุฃูุซุฑ.
- Displacement Window: ุนุฏุฏ ุงูุดู
ูุน ุงูุชู ููุงุตู ุงูู
ุคุดุฑ ุฎูุงููุง ุงูุชุธุงุฑ ุฅุบูุงู ุงูุงูุฏูุงุน ุจุนุฏ ุชุฃูุฏ ุงูุจูููุช ูุจู ุฅูุบุงุฆู.
ุงูู
ูุงุทู
- Width: ูุชุญูู
ูู ุงูุญุฏ ุงูุฃุฏูู ูุณู
ุงูุฉ ุงูู
ูุทูุฉ ุงูู
ุจูู ุนูู ุงูุชุฐุจุฐุจ.
- Zones Offset: ู
ุฏู ุงู
ุชุฏุงุฏ ุงูู
ูุงุทู ูููู
ูู.
- Max Zones Per Side: ุฃูุตู ุนุฏุฏ ู
ุชุฒุงู
ู ูู
ูุงุทู ุงูุนุฑุถ ูุงูุทูุจ.
- Hide Invalidated Zones: ุญุฐู ุงูู
ูุงุทู ุจุนุฏ ุฅุบูุงู ุงูุณุนุฑ ุฎูุงููุง.
ุงูุณุชุงูู: ุฃููุงู ุงูุชุนุจุฆุฉ ูุงูุญุฏูุฏ ููุนุฑุถ ูุงูุทูุจุ ููู
ุท ุฎุท ุงูู
ูุชุตู ู
ุชูุทุน ุฃู ู
ูููุท ุฃู ู
ุชุตู.
ู
ุคุดุฑ ุงููุฑูู
: ููุญุฉ ุตุบูุฑุฉ ุนูู ุงูุดุงุฑุช ุชุจููู ุงููุฑูู
ุงูุฐู ุฌุงุกุช ู
ูู ุงูู
ูุงุทูุ ู
ุน ุฎูุงุฑุงุช ุงูู
ูุถุน ูุงูุญุฌู
ูุงูููู.
ุทุฑููุฉ ุงูุงุณุชุฎุฏุงู
ุงุฌุนู ุงููุฑูู
ูู ุงูุฅุนุฏุงุฏุงุช ุฃุนูู ู
ู ูุฑูู
ุงูุดุงุฑุชุ ู
ุซู ู
ูุงุทู 4 ุณุงุนุงุช ุนูู ุดุงุฑุช 15 ุฏูููุฉุ ูุชุญุชูุธ ุจู
ุฑุฌุน ุจูููู ูุฃูุช ุชุนู
ู ุนูู ูุฑูู
ุฃุตุบุฑ. ุงูู
ูุงุทู ุชุนููู
ุฃู
ุงูู ุชูููู ุงุฎุชูุงู ูู ุงูุชูุงุฒู ุบุงุฏุฑ ุงูุณุนุฑ ู
ุณุชูุงูุง ุจุณุฑุนุฉุ ููู ู
ูุงุทู ุงูุชู
ุงู
ูู
ุฑุงูุจุฉ ุณููู ุงูุณุนุฑ ูุง ุฅุดุงุฑุงุช ุจุญุฏ ุฐุงุชูุง.
ุฎููุถ Sensitivity ูุงุฑูุน Pivot Length ุนูู ุงููุฑูู
ุงุช ุงูุตุบูุฑุฉ ุฃู ุงูุฃุณูุงู ุงูู
ุฒุนุฌุฉ ุฅุฐุง ุธูุฑุช ู
ูุงุทู ูุซูุฑุฉุ ูุงุฑูุน Sensitivity ุนูู ุงููุฑูู
ุงุช ุงููุจูุฑุฉ ุฃู ุงูุฃุฏูุงุช ุงูุจุทูุฆุฉ ุฅุฐุง ูุงูุช ุงูู
ูุงุทู ููููุฉ.
ุงูุชูุจููุงุช
ุชูุจููุงู ู
ุชุงุญุงู: ู
ูุทูุฉ ุนุฑุถ ุฌุฏูุฏุฉุ ูู
ูุทูุฉ ุทูุจ ุฌุฏูุฏุฉุ ูููุทููุงู ุนูุฏ ุชุฃููุฏ ุงูู
ูุทูุฉ ู
ู ุดู
ุนุฉ ู
ุบููุฉ ุนูู ุงููุฑูู
ุงูุฃุนูู.
ู
ูุงุญุธุงุช ูุญุฏูุฏ
- ุงูู
ุคุดุฑ ูุตู ุจููุฉ ุณุนุฑูุฉ ุชููููุช ุจุงููุนูุ ููุง ูุชูุจุฃ ุจุงูุงุชุฌุงู ููุง ูุนุทู ุฅุดุงุฑุงุช ุดุฑุงุก ุฃู ุจูุน.
- ุฌูุฏุฉ ุงูู
ูุงุทู ุชุนุชู
ุฏ ุนูู ุงููุฑูู
ูุงูุฃุฏุงุฉ ุงูู
ุฎุชุงุฑุฉุ ูุงูุฅุนุฏุงุฏุงุช ุงูุชู ุชูุงุณุจ ุณููุงู ูุง ุชูุงุณุจ ุบูุฑู ุชููุงุฆูุงู.
- ุงูุฑู
ูุฒ ุถุนููุฉ ุงูุณูููุฉ ุฃู ุงููุฑูู
ุงุช ุฐุงุช ุงููุฌูุงุช ุงููุงุณุนุฉ ูุฏ ุชุนุทู ุชุฃููุฏุงุช ุงูุฏูุงุน ุฃูู.
ูููุดุฑ ูุฐุง ุงูู
ุคุดุฑ ูุฃุบุฑุงุถ ุชุนููู
ูุฉ ูุชุญููููุฉ ููุทุ ูููุณ ูุตูุญุฉ ู
ุงููุฉ ููุง ูุถู
ู ุฃู ูุชูุฌุฉ. ุงุฎุชุจุฑ ุฃู ุฃุฏุงุฉ ุนูู ุฃุฏูุงุชู ููุฑูู
ุงุชู ูุจู ุงูุงุนุชู
ุงุฏ ุนูููุง. Penunjuk

Auto Trendlines - Support Resistance Touch-Graded [Dots3Red]๐ AUTO TRENDLINES - Support Resistance Touch-Graded
Most auto-trendline tools do one thing: draw a line and stop. This one keeps score. Every time price touches a detected trendline, the touch is graded on confirmed bars โ did price genuinely bounce away, or push through? The result is a running, honest record instead of a static line you're left to interpret on your own.
๐ฏ WHY THIS MATTERS
A trendline by itself is just a guess about where price might react. This script turns that guess into a measurement. Instead of assuming "trendlines work," it tracks โ on this specific chart, in real time โ how often they actually have. If a line has been touched four times and bounced three, you see exactly that: "4 touches ยท 3 bounced." No line gets the benefit of the doubt it hasn't earned.
โ๏ธ HOW IT WORKS
๐ Detection โ the script tracks one active resistance line (built from the two most recent confirmed pivot highs) and one active support line (from the two most recent pivot lows). A slope filter rejects near-horizontal lines, since those are levels, not trendlines โ different tool, different job.
๐ฏ Touch grading โ when price reaches close enough to a line (configurable tolerance), that touch enters a pending state. Within a set number of bars, it resolves one of three ways:
โข Bounce โ price moved away cleanly without breaking
โข Break โ price closed convincingly through the line; it retires and the line's story ends there
โข Timeout โ neither happened clearly enough to call
๐ Two layers of scoring โ each individual line carries its own tally (shown right on the chart), and the dashboard separately tracks a global bounce rate across every line the script has drawn on that chart, so far. That global number is the honest headline: it's what trendline touches have actually done here, not a theoretical average.
โจ Trendline glow โ each active line gets a soft fade extending away from it, independently. This isn't a channel โ resistance and support aren't matched pairs here, so the two glows are deliberately unrelated, each hugging only its own line.
๐ Non-repainting โ lines are built only from confirmed pivots and never quietly redrawn to fit later price. Touch grading happens only on confirmed bars. What you see historically is what happened, not a retrofit.
๐งญ HOW TO USE
1๏ธโฃ Read the label, not just the line. "3 touches ยท 1 bounced" and "3 touches ยท 3 bounced" look identical as a plain line, but tell very different stories about how much to trust the next touch.
2๏ธโฃ Check the dashboard's global Bounce Rate before leaning on any single line. If the aggregate rate on this chart is sitting at 35%, that's useful context โ it means trendlines haven't been particularly reliable here lately, regardless of how convincing any one line looks in isolation.
3๏ธโฃ Watch for the retirement. Once a line breaks, it's either removed immediately or kept as a dashed reference (your choice, see settings) โ either way, a broken line stops being "live" and stops collecting new touches. Don't keep treating a dashed line as active support/resistance.
4๏ธโฃ Tune the tolerance and outcome window to the instrument. A fast-moving crypto pair and a slow index behave very differently โ the default settings are a reasonable starting point, not a universal fit.
๐ ๏ธ SETTINGS
๐ Detection
โข Pivot Leg โ bars required each side to confirm a pivot; larger = fewer, more significant pivots
โข Require Meaningful Slope + Min Slope โ filters out near-horizontal lines
โข Max Line Age โ retires lines that have simply gotten too old
๐ฏ Touch Grading
โข Touch Tolerance โ how close price must come to count as a touch
โข Break Buffer โ how far past the line close must clear to count as a break
โข Bounce Distance โ how far price must move away, cleanly, to count as a bounce
โข Outcome Window โ bars allowed for a touch to resolve
๐จ Visualization
โข Line Stat Labels, Touch Markers โ toggle each independently
โข Show Broken Lines โ keep retired lines visible (dashed) or clear them immediately
โข Trendline Glow + Glow Fade Distance โ soft fade extending from each active line
EXAMPLE ( with Broken Trend Lines )
๐ฅ๏ธ Dashboard
โข Show/hide, position โ current resistance/support status, global bounce rate, break count, active pivot leg
๐ NOTES
Because only one resistance and one support line are actively tracked at a time, older structure isn't shown once a fresher pivot pair replaces it (unless "Show Broken Lines" is enabled). This script measures how trendlines have behaved on this chart โ it does not predict how any specific future touch will resolve.
โ ๏ธ DISCLAIMER
This is an analytical and visualization tool. It does not generate trade signals and does not constitute financial advice. Historical bounce/break rates do not guarantee future performance. Penunjuk

HTF Swing Highs & LowsAn open-source multi-timeframe market structure indicator that automatically identifies and projects confirmed swing highs and swing lows from the Weekly, Daily, and 4-Hour timeframes onto any lower timeframe chart.
The indicator is designed to provide clean, non-repainting support and resistance levels based on confirmed market structure rather than developing pivots.
Features
- Weekly, Daily and 4H swing highs and lows
- Non-repainting confirmed pivots
- Automatic higher timeframe detection using request.security()
- Horizontal levels extended until invalidated
- Independent visibility controls for each timeframe
- Hierarchical timeframe filtering
- Custom colours and line widths for every timeframe
- Adjustable pivot strength
- Wick, Close or Never invalidation options
- Stop or Delete broken levels
- Automatic level management to prevent exceeding TradingView object limits
How it works
The script uses confirmed pivot highs and lows from higher timeframes.
Unlike developing pivots, a swing is only confirmed after the selected number of candles has formed on both sides of the pivot. Once confirmed, a horizontal level is created at the swing price and extended to the right.
Because only confirmed pivots are used, historical levels do not repaint.
Pivot Strength
Pivot Strength controls how significant a swing must be before it becomes a level.
A strength of 3 means the pivot candle must have:
- three lower highs (or higher lows) before it
- three lower highs (or higher lows) after it
Higher values filter market noise and identify more significant market structure.
They also produce fewer levels and require longer confirmation.
Lower values detect smaller swings, produce more levels, react faster.
Level Invalidation
Choose how a level is treated once price trades through it.
Wick - Invalidates when price wicks beyond the level.
Close - Invalidates only after a candle closes beyond the level.
Never - Levels remain permanently.
Broken levels can either:
- Stop extending while remaining visible
- Be deleted completely
Hierarchical Visibility
The indicator can automatically display only relevant higher timeframe levels.
For example:
- Weekly levels appear on Weekly and all lower timeframes.
- Daily levels appear on Daily and all lower timeframes.
- 4H levels appear on 4H and lower charts.
This helps reduce clutter when analysing higher timeframe charts.
Notes
- Uses confirmed higher timeframe pivots only.
- Levels are anchored to the original swing candle.
- Designed for support and resistance, market structure, liquidity analysis, and confluence with other tools.
- Works on all symbols and asset classes supported by TradingView. Penunjuk

Navyraid FVANavyraid FVA (Fair Value Area)
Description:
Overview
The Navyraid Fair Value Area (FVA) is a specialized analytical tool built upon the principles of Auction Market Theory (AMT). According to AMT, financial markets exist to facilitate trade, constantly moving between states of balance and imbalance. The market tends to travel from one established Value Area to another.
This indicator maps out these crucial areas by analyzing where the market spends the most time and how frequently specific price levels are visited throughout the trading day. By identifying these zones of high historical acceptance, the indicator projects key levels from previous sessions that act as strong magnets and significant support/resistance zones for current and future market action.
How It Works (Core Logic)
The indicator evaluates price action by breaking down the high-to-low range of each candle into specific discrete price bins (ticks). It then tallies how often the price trades through each bin over a defined period (daily basis).
Value Area Calculation: It accumulates these price interactions to find the area where a specified percentage of trading activity occurred (default is 68%, representing one standard deviation of the mean).
Key Level Extraction: It isolates the single price levels with the highest concentration of activity for both the Mayor and Minor FVA.
Main Features
Mayor FVA: This represents the Point of Control (POC) or the price level with the highest time accumulation strictly within the 68% Value Area. This zone acts as the primary focal point of market balance and a high-probability price magnet.
Minor FVA: This marks the most significant high-time node located strictly outside the established Value Area. These peripheral nodes frequently serve as crucial turning points, rejection zones, or targets when the market breaks out of its primary balance.
Smart Mitigation (Freeze Logic): To keep the chart clean and relevant, FVA zones are projected forward as boxes. By default, once the current price touches or "mitigates" an extended box, the box stops extending (freezes).
Force Extend: A toggle that overrides the mitigation logic, forcing the FVA boxes to continuously project forward regardless of price interaction, useful for long-term level tracking.
Auto Tick Size: The script automatically scales the bin sizes based on the asset's specific price range and minimum tick, making it universally applicable across Forex, Indices, Crypto, and Equities without manual adjustment.
How to Use in Trading
Traders can utilize the Navyraid FVA to understand the broader market context based on AMT.
Targets: If the price is moving directionally, previous Mayor FVAs serve as logical take-profit zones, as the market seeks historical balance.
Reactions: Minor FVAs can be observed for potential pullbacks or continuation setups when the market tests extreme areas outside of the previous day's accepted value.
Disclaimer: This indicator is designed for educational and analytical purposes to visualize Auction Market Theory concepts. It does not constitute financial advice. Penunjuk

ICT Smart Money Execution Engine PROICT Smart Money Execution Engine PRO
ICT Smart Money Execution Engine PRO is an advanced, high precision technical analysis tool designed for traders practicing Inner Circle Trader and Smart Money Concepts methodologies. It automatically maps structural context, liquidity sweeps, macro price extremes, and key session windows while keeping your charting environment ultra clean.
Key Features Overview
1. Intermediate Term Highs and Lows Badge Labels
Identifies major market turning points with distinct solid badge style labels. Intermediate Term Highs are clearly displayed with red ITH badges above swing points, and Intermediate Term Lows are displayed with green ITL badges below swing points.
2. Auto Mitigating Previous Day High and Low
Projects active daily boundaries on your chart. To prevent visual clutter, Previous Day High and Previous Day Low lines automatically delete as soon as price touches or mitigates them.
3. Red Line Termination Liquidity Sweeps
Tracks high probability liquidity pools sitting above swing highs and below swing lows. When price sweeps liquidity, a solid 2x width red line connects the original swing point directly to the sweeping candle wick, terminating instantly with a clear Liquidity Swept label.
4. Dynamic Auto Mitigating Fair Value Gaps
Automatically identifies bullish and bearish price imbalances across all timeframes. Unmitigated FVG boxes dynamically clean up and vanish as soon as price returns to fill them.
5. Volume Validated Order Blocks
Detects key institutional order block zones using a customizable 50 bar lookback by default. Zones remain active until price firmly closes beyond their boundaries.
6. Clean New York Session Highlight
Provides a single, ultra light background overlay specifically for the New York Session window, eliminating the distraction of multiple overlapping global sessions.
7. Market Structure Shift Detection
Tracks momentum reversals in real time by drawing clean dashed structure lines and MSS labels when key structural pivots are broken by candle closes.
How to Use
Step 1: Determine Macro Bias
Use the red ITH and green ITL badges to locate institutional swing extremes and understand the broader market trend.
Step 2: Focus on New York Session
Analyze price action during the highlighted New York Session window when market volume and institutional volatility are highest.
Step 3: Identify Liquidity Sweeps
Watch for price to sweep an active Previous Day High, Previous Day Low, or recent swing level marked by the bold red Liquidity Swept line.
Step 4: Execute on Structural Confirmation
Wait for a Market Structure Shift signal following a liquidity sweep, then evaluate entries on retaps into active Order Blocks or Fair Value Gaps.
Settings Overview
ITH / ITL Settings
- Show ITH / ITL Badge Labels: Toggle visibility of intermediate swing badges.
- Lookback Sensitivity Length: Adjust pivot lookback sensitivity for detecting macro highs and lows.
- Colors: Customization options for ITH and ITL badge background colors.
Previous Day High and Low Settings
- Show Active PDH / PDL: Toggle display of auto disappearing daily levels.
- Line Width and Style: Choose between solid, dotted, or dashed line styles and adjust thickness.
Fair Value Gap Settings
- Show Active FVGs: Toggle dynamic imbalance box visibility.
- FVG Transparency: Adjust fill opacity for bullish and bearish boxes.
Order Block Settings
- OB Lookback Length: Customize the pivot length used for order block detection (default is set to 50).
Liquidity Sweep Settings
- Show Liquidity Sweeps: Toggle sweep lines and labels.
- Sweep Line Color: Customize the color of the 2x width sweep termination line.
Session Settings
- Show Only New York Session: Toggle visibility of the session background highlight.
- NY Session Window: Set exact session hours to match your local or UTC-4/5 preferences.
Disclaimer
This script is built strictly for educational, analytical, and charting enhancement purposes. It does not provide financial advice, automated trading signals, trade management, or guaranteed results. Trading financial markets involves substantial risk of capital loss. Always perform your own analysis and practice strict risk management.
Penunjuk

Zone Radar [DefinedEdge]Price spends most of its time going nowhere. Zone Radar finds those stretches automatically, draws the range while it's still forming, and tells you the moment it breaks and how hard.
๐ฏ What it does
Zone Radar watches for price coiling inside a bounded range. When a genuine consolidation forms, it marks the zone with its support and resistance, then tracks it live. The instant price closes decisively outside the range, it flags the break and scores its strength from 0 to 100. Strong breaks get a bold label and a projected target.
It is a context and breakout tool, not a signal service. It shows you where the market is compressed and when that compression releases. What you do with that read is yours.
๐งญ How a zone is found
A range only qualifies when two things are true at once:
Price stays inside an ATR normalised band for a minimum number of bars, so the width adapts to any symbol or timeframe on its own.
Price does not drift across that band from one side to the other, which filters out slow trends pretending to be ranges.
Once a zone is confirmed the box breathes to hug the real range, but it is capped at the width it formed with. That cap is what makes a breakout meaningful: a close beyond it is a true expansion out of compression, not just another bar inside the noise.
๐ฅ Break strength (0 to 100)
Every break is graded on four things that separate a real breakout from a fake one:
Displacement how far beyond the edge it closed, in ATR
Range expansion the break bar's range against its recent average
Volume surge participation on the break (auto adjusted on symbols with no volume data, like spot FX)
Coil quality how long and tight the range was, since a longer coil breaks harder
Breaks at or above your Strong threshold get the bold badge plus a measured move target: the height of the range projected from the breakout point. Broken edges stay on the chart as polarity support and resistance for the retest.
โ๏ธ Under The Hood
Signals fire on the close of the breakout bar. No repainting, ever.
Fully adjustable: range length, width, break sensitivity, strength threshold, and how much history stays on the chart.
Works on any market and any timeframe. Tuned nicely for intraday out of the box.
๐ Alerts
Zone formed, break up, break down, strong break up, strong break down. Wire any of them into your workflow.
๐ Notes
Lower timeframes produce far more zones than higher ones, so only the most recent are kept drawn to stay within platform limits. Raise the zone cap if you want more history, or drop to a higher timeframe for a cleaner chart. The ATR based settings are a starting point, not gospel. Tune them to how your instrument actually moves. Penunjuk

Support Resistance AI [PickMyTrade]Every support/resistance tool answers "where are the levels." None answer the question a trader actually has when price arrives at one: does THIS test look like the ones that held, or like the ones that broke?
โโโโโโโโโโโโโโโโโโโโโโโโโโโโโโโโโโโโโโ
๐ท WHAT IT MEASURES
๐ธ Confirmed swing pivots, clustered into zones and merged as new evidence accumulates
๐ธ Eight properties of every ARRIVAL at a zone โ approach speed, relative volume, prior test count, zone age, trend pressure, zone width, pivot count, and cumulative touches
๐ธ A broken level isn't discarded โ it flips role once (broken support becomes candidate resistance) and only a second failure retires it
๐ธ A live Previous Day/Week High/Low reference map, shown only when price is within range
โโโโโโโโโโโโโโโโโโโโโโโโโโโโโโโโโโโโโโ
๐ท THE CLASSIFIER
๐ธ An online Gaussian Naive Bayes model, trained continuously as tests resolve โ no repainting, no lookahead
๐ธ Nothing about a level's price is used as a feature โ only how price approached it
๐ธ The classic claim that "a level tested repeatedly grows weaker" is measured on each chart's own history here, rather than assumed
๐ธ Below a configurable warmup sample count, the script shows the chart's running hold rate instead and reads LEARNING โ it never guesses early
โโโโโโโโโโโโโโโโโโโโโโโโโโโโโโโโโโโโโโ
๐ท SIGNALS AND DISPLAY
๐ธ Zone boxes colored by role (support/resistance) and shaded by live conviction, with worded verdicts ("similar arrivals held X%") instead of a bare number
๐ธ Rank-based visibility โ only the nearest zones to current price are drawn, so old or distant levels never stretch the chart's scale
๐ธ Test history ticks stamped inside each zone at the bar where its own tests resolved
๐ธ An info table with Nearest Support/Resistance, model accuracy, and sample counts
๐ธ 3 alertconditions, worded as observations of what the classifier's reading โ never as trade instructions
โโโโโโโโโโโโโโโโโโโโโโโโโโโโโโโโโโโโโโ
๐ท INPUTS
Pivot Left/Right Bars โ swing detection window. Default 10/10.
Zone Width / Merge Distance โ band thickness and clustering tolerance, in ATR. Default 0.5 / 0.75.
Break Buffer / Rejection Distance โ how far price must close beyond or travel back from a zone to resolve a test. Default 0.25 / 0.75 ATR.
Post-Flip Cooldown โ bars a flipped zone must survive before a break can retire it. Default 5.
Warmup Samples โ resolved tests required before the classifier is trusted. Default 25.
Conviction Threshold โ probability at which a zone is shown at full conviction. Default 0.62.
Max Live Zones / Show Distance โ how many nearby zones are drawn and how far (in ATR) before one is hidden.
Show Trend EMA, Zen Mode โ display toggles; Zen Mode hides labels and the table for clean screenshots.
โโโโโโโโโโโโโโโโโโโโโโโโโโโโโโโโโโโโโโ
๐ท REQUIREMENTS AND LIMITATIONS
๐ธ Pivots confirm only after the right-side lookback bars close โ a level appears on the chart later than the swing that created it, by design
๐ธ One thing does refine retroactively: when a later pivot merges into an existing zone, its band re-centers toward the weighted average โ a zone with an open test is never re-centered, so no in-progress outcome is affected
๐ธ Early on a fresh chart, or for a zone with only one or two tests, its own read is thin โ the model's overall sample count travels with every verdict so that's never hidden
๐ธ This script reports how historical arrivals resolved. It does not predict, and it is not a trading system on its own.
โโโโโโโโโโโโโโโโโโโโโโโโโโโโโโโโโโโโโโ
Built in Pine Script v6. Open source โ Mozilla Public License 2.0. Penunjuk

Fan Principle Signals [MarkitTick]๐ก Maps out market structure using a sequence of ascending swing lows (or descending swing highs) to construct a three-legged trendline fan, then triggers actionable trade signals the moment price breaks through the steepest line in that fan. Rather than relying on a single moving average or oscillator crossover, this script builds its bias from the actual geometry of recent price swings, giving traders a structural, visually intuitive way to time entries around the exhaustion of a trend.
โจ Originality and Utility
Most breakout tools react to a single reference line, such as a moving average, a fixed channel, or a static trendline drawn from only two points. This script instead applies the fan principle, a technique that connects a common origin point to three successive pivots in the same trend, producing three lines of increasing steepness. The logic behind this approach is that the third and steepest line in the fan typically represents the most aggressive rate of trend continuation, and a decisive close beyond it has historically signaled that the prevailing trend has lost its structural support.
What makes this implementation useful in practice is that it does not stop at drawing the fan. It automatically identifies valid pivot sequences from raw price action, filters out insignificant micro-swings using a minimum leg percentage threshold, validates the freshness of the structure with a lookback cap, and then converts the break event into a complete trade plan, including entry, stop-loss, and three take-profit levels, all derived mathematically from the fan's own geometry and the market's current volatility. The optional volume and higher-timeframe filters allow traders to demand additional confirmation before a signal is accepted, and the built-in dashboard keeps the entire state of the system visible at a glance. The combination of automated structural fan detection, ATR-adaptive risk placement, and live trade monitoring is what distinguishes this from a simple trendline break script.
๐ฌ Methodology and Concepts
โข Pivot Detection
The script continuously scans for swing highs and swing lows using a symmetrical lookback and lookforward window defined by the Pivot Len input. A bar qualifies as a swing high only if it is strictly greater than every other bar within that window on both sides, and a swing low only if it is strictly lower than every bar in that window. Each time a new pivot is confirmed, its bar index and price are stored in a rolling array, keeping the most recent twenty pivots in memory for both highs and lows.
โข Fan Construction
Once at least four pivot lows (for an uptrend fan) or four pivot highs (for a downtrend fan) are available, the script selects the four most recent ones. The oldest of the four becomes the fan's origin point. The remaining three form Leg 1, Leg 2, and Leg 3 respectively, each connected back to that same origin. A slope is then calculated for each leg using simple rise-over-run between the origin and that leg's pivot. For the fan to be accepted, the price move between the origin and the first leg must exceed the Min Leg % threshold, which filters out fans built from statistically insignificant noise, and the origin must fall within the Max Fan Lookback window, which prevents the script from anchoring to structure that is too old to remain relevant.
โข The Break Condition
Leg 3, the line connecting the origin to the most recent and steepest pivot, is treated as the trigger line. Its price value is projected forward on every bar using the slope calculated at formation. A bullish break requires the fan to currently be in an uptrend orientation, the previous confirmed bar's close to be above the projected Leg 3 value, and the bar before that to have closed at or below it, meaning the break itself happens on a confirmed, completed bar rather than an in-progress one. The bearish break condition mirrors this logic in the opposite direction for downtrend fans. This confirmed-close approach means the script never fires or removes a signal based on an incomplete, still-forming bar, so historical signals will not disappear or move once printed.
โข Optional Confirmation Filters
Two independent filters can be layered on top of the raw break condition. The volume filter requires the breaking bar's volume to exceed a multiple of its recent moving average, screening out breaks that occur on unusually thin participation. The higher-timeframe filter compares the breakout bar's close against the prior, fully closed bar on a higher timeframe of your choosing, requiring the breakout direction to align with that broader trend context before a signal is allowed to fire.
โข Trade Level Calculation
When a break is confirmed, the script builds an entry, stop, and three take-profit levels automatically. Entry is anchored to the close of the breakout bar. The stop-loss is placed beyond the nearest of the two most recent fan legs, offset further by a small ATR buffer to avoid being clipped by minor wicks, but it is also capped by a maximum ATR distance so a single outlier swing cannot produce an oversized stop. The distance between entry and stop becomes the base risk unit, and the three take-profit levels are placed at user-defined multiples of that risk unit, giving a consistent, R-multiple-based framework for managing the position rather than arbitrary fixed-price targets.
๐จ Visual Guide
Dotted lines connecting the origin point to Leg 1 and Leg 2 show the earlier, less steep sections of the fan structure and provide visual context for how the trend developed.
The solid, extended line represents Leg 3, the active trigger line. It is colored using the Bull Fan color when the fan is in an uptrend orientation and the Bear Fan color when it is in a downtrend orientation, and it projects forward in real time as new bars form.
A blue dashed line marks the Entry level once a signal fires, extending to the right for as many bars as the trade remains active or until a new signal replaces it.
A red solid line marks the Stop-Loss level, with a light red shaded zone (the Risk Fill) drawn between the entry and stop lines to make the risk portion of the trade immediately visible.
Three dashed lines in progressively deeper shades of teal mark Take-Profit 1, 2, and 3, moving from lightest (TP1, closest to entry) to fully opaque (TP3, furthest away). A light teal shaded zone (the Reward Fill) spans from the entry line to the TP3 line, visually contrasting the reward portion of the trade against the risk portion.
Small labels are anchored to each of these lines on the left, displaying the exact price of the Stop, Entry, and each Take-Profit level, and updating their horizontal position as the trade progresses.
An upward-pointing "โฒ BUY" label appears below the breakout bar on a bullish break, and a downward-pointing "โผ SELL" label appears above the breakout bar on a bearish break.
An optional on-chart dashboard table displays the ticker and timeframe, whether the Lock Signal feature is active, the current fan orientation, the origin price, the live value of the Leg 3 trigger line, the current entry, stop, a live risk-to-reward progress bar showing how far price has travelled toward TP3 relative to the initial risk, the volume filter status, and the number of bars elapsed since the last signal.
๐ How to Use
A signal is generated only when price decisively closes beyond the Leg 3 trigger line of an established fan, so treat the fan's orientation, shown both by the line color and by the Fan State readout on the dashboard, as the prevailing structural bias before a break occurs. When a bullish break prints, the suggested plan is to consider a long entry near the displayed Entry line, with the Stop-Loss line defining the invalidation point below and the three Take-Profit lines offering staged exit levels as the move develops. A bearish break mirrors this in the opposite direction for short setups.
The R:R Progress bar on the dashboard is useful for monitoring an active trade at a glance: it fills from 0% toward 100% as price advances from entry toward the TP3 target, and its color shifts from red through amber to teal as the trade's risk-to-reward ratio improves. If the Lock Signal option is enabled, the script freezes the most recently confirmed signal and its levels in place rather than allowing a new one to overwrite them, which can help when you want to manage an open position without the on-chart levels shifting. Because signals are confirmed only on closed bars, always wait for bar close before acting on a fresh line break rather than reacting to an in-progress wick.
Enabling the optional Volume and HTF filters will typically reduce signal frequency while raising the bar for confirmation, so consider testing both configurations to see which better matches the behavior of the instrument and timeframe you trade.
โ๏ธ Inputs and Settings
Pivot Len โ Controls how many bars on each side must confirm a swing high or low. Smaller values detect pivots faster but produce noisier, more frequent fan structures; larger values produce fewer but more structurally significant pivots.
Max Fan Lookback โ The maximum age, in bars, that a fan's origin point can have and still be considered valid. Lowering this keeps the script focused on recent structure only.
Min Leg % โ The minimum percentage price move required between the origin and the first leg for a fan to be accepted, filtering out fans built on insignificant price movement.
Use Vol Filt / Vol Avg Len / Vol Mult โ Enables a volume confirmation requirement, comparing current volume against its moving average over the specified length, multiplied by the chosen factor.
Use HTF Filt / HTF โ Enables a higher-timeframe trend alignment requirement, comparing the breakout close against the prior confirmed close on the chosen higher timeframe.
SL ATR Buf โ The ATR-based buffer added beyond the nearest fan leg when placing the stop-loss, giving the stop room to avoid minor wick noise.
SL Max ATR โ A ceiling, expressed in ATR multiples, on how far the stop-loss can be placed from entry, preventing outsized stops on unusually wide fans.
ATR Len โ The lookback length used for the ATR calculation that feeds both the stop buffer and the stop cap.
TP1 R / TP2 R / TP3 R โ The risk-multiple distances used to place the three take-profit levels relative to the initial risk unit between entry and stop.
Lock Signal โ Freezes the current signal and its associated levels in place, preventing a new signal from overwriting them until manually disabled.
Show Fan Lines / Show Trade Levels / Show Labels โ Independently toggle the visibility of the fan structure lines, the entry/stop/TP levels, and their accompanying price labels.
Show Dash / Dash Pos โ Toggle the on-chart dashboard and choose which corner of the chart it is anchored to.
A full set of color inputs is available to customize the fan lines, trade level lines, fill zones, signal labels, and dashboard appearance to match your own chart theme.
๐ Deconstruction of the Underlying Scientific and Academic Framework
The fan principle applied here descends from classical technical analysis literature on trendline construction, most notably the Gann fan and Andrews' Pitchfork family of tools, which share the premise that connecting a structural origin point to successive swing extremes produces a family of trendlines whose slopes carry predictive meaning about the trend's rate of change. Where this script departs from those older, largely manual techniques is in how the origin and legs are selected: rather than relying on the analyst's subjective choice of anchor points, pivot selection here is fully algorithmic, using a symmetric local-extremum test to ensure each point used is objectively the highest or lowest price within its surrounding window.
The core statistical assumption underlying any trendline-break system is that price trends exhibit a degree of serial correlation, meaning that the rate of ascent or descent between swing points tends to persist for some period before mean-reverting or reversing, and that a violation of the most recent, steepest rate of change is informative about a shift in that underlying process. This is conceptually related to the broader family of change-point detection methods used in time-series analysis, where a structural break in a fitted trend line is used as a signal that the data-generating process has shifted regime. The ATR-based position sizing layered on top draws from the well-established use of Average True Range as a volatility-normalized unit of risk, a concept popularized in behavioral and quantitative trading literature as a way of scaling stop and target distances to the instrument's own recent volatility rather than using arbitrary fixed-point distances, which do not generalize across different assets or market conditions.
โ ๏ธ Disclaimer
All provided scripts and indicators are strictly for educational exploration and must not be interpreted as financial advice or a recommendation to execute trades. We expressly disclaim all liability for any financial losses or damages that may result, directly or indirectly, from the reliance on or application of these tools. Market participation carries inherent risk where past performance never guarantees future returns, leaving all investment decisions and due diligence solely at your own discretion. Penunjuk

Major Historical S&R ZonesMajor Historical Support & Resistance Zones
Major Historical Support & Resistance Zones is designed to objectively identify and rank the most significant historical support and resistance areas on any market or timeframe. Rather than relying on manually drawn horizontal lines, the indicator automatically analyses historical price action, groups significant reactions into zones, and scores each zone based on its historical importance.
The indicator looks for meaningful pivot highs and lows, measures the strength of the subsequent price reaction using ATR (Average True Range), evaluates rejection quality through wick analysis, and clusters nearby reactions into a single support or resistance zone. When multiple significant reactions occur around the same price level, the zone becomes stronger and receives a higher score.
Unlike traditional support and resistance indicators that simply draw every swing high and low, this indicator attempts to filter out market noise and highlight only the price areas that have repeatedly influenced market direction.
Features
* Automatically detects major historical support and resistance zones.
* Clusters multiple historical reactions into a single zone.
* Scores each zone based on reaction quality and historical significance.
* Counts the number of independent reactions ("Hits") at each level.
* Identifies Support/Resistance Flip zones where price has historically acted as both support and resistance.
* Adjustable ATR sensitivity and clustering distance.
* Built-in colour and scoring guide that can be enabled or disabled from the settings.
Colour Guide
๐ฉ Green Zone
* Price is currently above the zone.
* The zone is acting as historical support.
๐ฅ Red Zone
* Price is currently below the zone.
* The zone is acting as historical resistance.
๐จ Orange Zone
* Price is currently trading inside the historical zone.
* This represents a decision area where the market is testing historical support or resistance.
Understanding the Score
Each zone receives a strength score based on:
* Size of the historical reaction.
* Quality of price rejection (wick analysis).
* Number of independent reactions.
* Support/Resistance Flip bonus.
General interpretation:
* 0โ3 = Weak
* 3โ5 = Minor
* 5โ7 = Good
* 7โ10 = Strong
* 10โ15 = Very Strong
* 15+ = Exceptional
Higher scores indicate areas where price has historically shown stronger reactions.
Understanding Hits
Hits represent the number of separate significant reactions that occurred within the zone.
General guide:
* 1 = Single historical reaction
* 2 = Confirmed level
* 3 = Strong level
* 4โ5 = Very strong level
* 6+ = Major historical level
More hits generally indicate greater historical recognition of that price area.
S/R Flip
When a zone displays S/R Flip, it means that the same price area has historically acted as both:
* Support
* Resistance
These zones often represent some of the strongest historical price levels because market participants have repeatedly recognised them from both directions.
Suggested Workflow
For the best results:
1. Open the Weekly chart to identify the strongest long-term support and resistance zones.
2. Switch to the Daily chart to refine those major levels.
3. Use the 4H, 8H, or 12H chart for additional precision.
4. Execute trades using your preferred lower timeframe confirmation.
This top-down approach helps maintain focus on the most significant historical levels before refining entries.
Inputs
The indicator provides several adjustable settings:
* Pivot Strength โ Controls how significant a swing must be before it is considered.
* ATR Length โ Used to normalise reaction size across different markets.
* Minimum Reaction ATR โ Filters out weak reactions.
* Cluster Distance ATR โ Controls how close reactions must be before they are grouped together.
* Zone Width ATR โ Determines the thickness of each support/resistance zone.
* Minimum Hits โ Minimum number of reactions required before displaying a zone.
* Minimum Score โ Minimum strength score required before displaying a zone.
* Display Options โ Toggle labels and the built-in legend on or off.
Best Practices
This indicator is designed to identify historically important price zones, not generate buy or sell signals.
The strongest trading opportunities often occur when:
* High-scoring zones align with your own market structure analysis.
* Higher timeframe zones overlap with lower timeframe confirmations.
* Price shows clear rejection or acceptance at the identified historical levels.
As with all technical analysis tools, this indicator should be used alongside sound risk management and your broader trading methodology rather than in isolation.
Penunjuk