OPEN-SOURCE SCRIPT
Active Addresses Z-Score
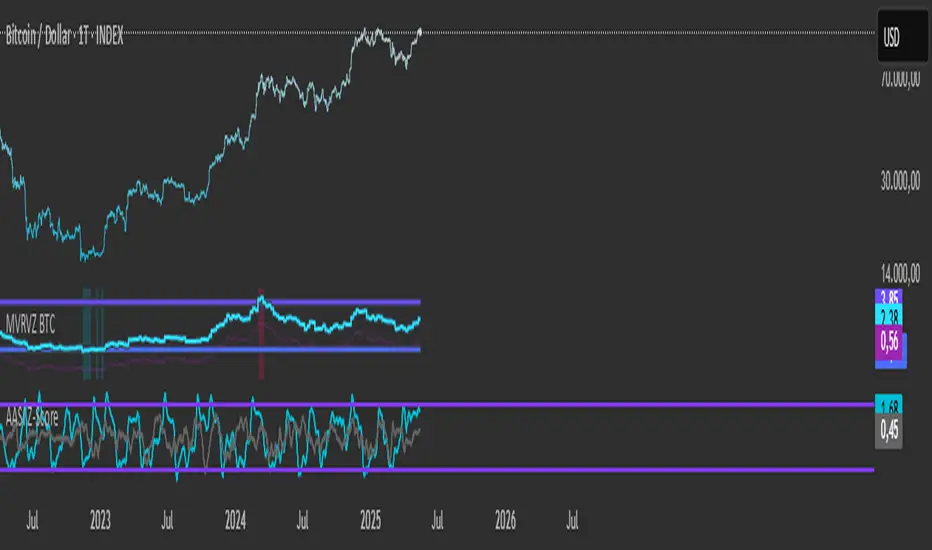
Active Addresses Z-Score Indicator
The Active Addresses Z-Score Indicator is a fundamental analysis tool designed to evaluate the relationship between Bitcoin network activity and its price movements over a specified period. This indicator aims to provide insights into whether the market is showing signs of increasing or decreasing interest in Bitcoin, based on its network usage and activity.
How to Read the Indicator
Orange Line (Price Z-Score):
This line represents the Z-Score of the price change over a defined period (e.g., 28 days). The Z-Score normalizes the price change by comparing it to the historical mean and standard deviation, essentially measuring how far the current price change is from the average.
A positive Z-Score indicates that the price change is above the historical average (a bullish signal), while a negative Z-Score means the price change is below the historical average (a bearish signal).
Gray Line (Active Addresses Z-Score):
This line represents the Z-Score of the change in active addresses over the same period. The Z-Score here normalizes the change in the number of active Bitcoin addresses by comparing it to historical data.
A positive Z-Score suggests that the number of active addresses is increasing more than usual, which can be a sign of increased market activity and potential interest in Bitcoin.
A negative Z-Score suggests that active addresses are decreasing more than usual, which may indicate reduced interest or usage of Bitcoin.
Upper and Lower Threshold Lines:
The upper and lower threshold lines (set by the user) act as Z-Score boundaries. If either the price Z-Score or the active address Z-Score exceeds the upper threshold, it can signal an overbought or overactive condition. Similarly, if the Z-Score falls below the lower threshold, it could indicate an oversold or underactive condition.
These thresholds are customizable by the user, allowing for flexible interpretation based on market conditions.
Indicator Calculation
Price Change Calculation:
The percentage change in the Bitcoin price over a specified lookback period (e.g., 28 days) is calculated as:
Price Change
=
Close
−
Close
[
28
]
Close
Price Change=
Close
Close−Close[28]
This shows the relative price movement during the specified period.
Active Address Change Calculation:
Similarly, the percentage change in active addresses is calculated as:
Active Address Change
=
Active Addresses
−
Active Addresses
[
28
]
Active Addresses
Active Address Change=
Active Addresses
Active Addresses−Active Addresses[28]
This shows the relative change in the number of active Bitcoin addresses over the same period.
Z-Score Calculation:
The Z-Score for both the price and active address changes is calculated as:
𝑍
=
X
−
𝜇
𝜎
Z=
σ
X−μ
Where:
X is the current change (price or active addresses),
μ (mu) is the mean (average) of the historical data over the lookback period,
σ (sigma) is the standard deviation of the historical data.
This Z-Score tells you how far the current value deviates from its historical average, normalized by the volatility (standard deviation).
Smoothing (Optional):
A simple moving average (SMA) is applied to smooth out the Z-Score values to reduce noise and provide a clearer trend.
What the Indicator Does
Signals of Bullish or Bearish Market Behavior:
The Z-Score of Price tells you how strong or weak the price movement is relative to its past performance.
The Z-Score of Active Addresses reveals whether more users are interacting with the Bitcoin network, which can be an indication of growing interest or market activity.
When both the price and active address Z-Scores are high, it may indicate a strong bull market, while low Z-Scores may point to a bear market or decreasing interest.
Overbought/Oversold Conditions:
The upper and lower threshold lines help you visualize when the Z-Scores for either price or active addresses have reached extreme values, signaling potential overbought or oversold conditions.
For example, if the Price Z-Score exceeds the upper threshold (e.g., +2), it might indicate that the price has risen too quickly, and a correction may be due. Conversely, if it falls below the lower threshold (e.g., -2), it may indicate a potential buying opportunity.
Important Note on Activity and Price Movements:
After Rapid Price Increases:
A sharp increase in Bitcoin’s price followed by a spike in active addresses can be interpreted as a bearish signal. High network activity after a rapid price surge might indicate that investors are taking profits or that speculative interest is peaking, potentially signaling an upcoming correction or reversal.
After Extreme Price Declines:
Conversely, high network activity after a significant price drop may indicate a bottoming signal. A surge in active addresses during a price decline could suggest increased buying interest and potential accumulation, signaling that the market may be finding support and a reversal may be imminent.
Customization and Flexibility
The lookback period (default: 28 days) can be adjusted to suit different trading strategies or time horizons.
The smoothing length (default: 7 periods) allows for smoothing the Z-Score, making it easier to detect longer-term trends and reduce noise.
The upper and lower threshold values are fully customizable to adjust the indicator’s sensitivity to market conditions.
Conclusion
The Active Addresses Z-Score Indicator combines network activity with price data to give you a deeper understanding of the Bitcoin market. By analyzing the relationship between price changes and active address changes, this indicator helps you assess whether the market is experiencing unusual activity or if Bitcoin is trending in an extreme overbought or oversold condition.
It is a powerful tool for fundamental analysis and can complement traditional technical indicators for a more comprehensive trading strategy.
Skrip sumber terbuka
Dalam semangat TradingView sebenar, pencipta skrip ini telah menjadikannya sumber terbuka, jadi pedagang boleh menilai dan mengesahkan kefungsiannya. Terima kasih kepada penulis! Walaupuan anda boleh menggunakan secara percuma, ingat bahawa penerbitan semula kod ini tertakluk kepada Peraturan Dalaman.
Penafian
Maklumat dan penerbitan adalah tidak bertujuan, dan tidak membentuk, nasihat atau cadangan kewangan, pelaburan, dagangan atau jenis lain yang diberikan atau disahkan oleh TradingView. Baca lebih dalam Terma Penggunaan.