30 custom RS
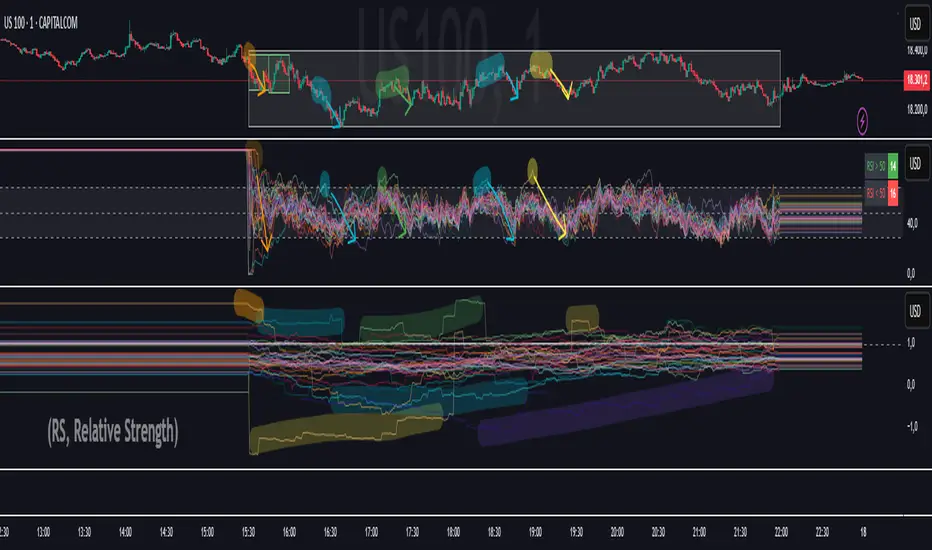
This script is extremely useful for understanding how many companies have a positive correlation and how many have a negative one. If many companies show a negative correlation, it could indicate the beginning (not yet evident) of a bear phase. On the other hand, if many companies show a positive correlation, it could indicate the beginning (not yet evident) of a bull phase.
Regardless of whether the correlation is positive or negative, the lower the correlation, the more likely it is that the given symbol won't produce fake signals on indicators like the RSI or CCI.
So essentially, this indicator shows a composite RS
This indicator is designed to be used in combination with other similar tools I've published, which track the RSI,CCI, ATR, MACD, etc., of the top 30 NASDAQ companies
In particular, I recommend using this script if you plan to use any other indicators from the 'Composite 30' series, as it is the one that most validates any signals received from the composite charts. This is because it allows you to determine the level of correlation between the BENCHMARK and the others that make up the composite.
Skrip sumber terbuka
Dalam semangat sebenar TradingView, pencipta skrip ini telah menjadikannya sumber terbuka supaya pedagang dapat menilai dan mengesahkan kefungsiannya. Terima kasih kepada penulis! Walaupun anda boleh menggunakannya secara percuma, ingat bahawa menerbitkan semula kod ini adalah tertakluk kepada Peraturan Dalaman kami.
Untuk akses pantas pada carta, tambah skrip ini kepada kegemaran anda — ketahui lebih lanjut di sini.
Penafian
Skrip sumber terbuka
Dalam semangat sebenar TradingView, pencipta skrip ini telah menjadikannya sumber terbuka supaya pedagang dapat menilai dan mengesahkan kefungsiannya. Terima kasih kepada penulis! Walaupun anda boleh menggunakannya secara percuma, ingat bahawa menerbitkan semula kod ini adalah tertakluk kepada Peraturan Dalaman kami.
Untuk akses pantas pada carta, tambah skrip ini kepada kegemaran anda — ketahui lebih lanjut di sini.