PROTECTED SOURCE SCRIPT
AMTD-GME Correlation Detector
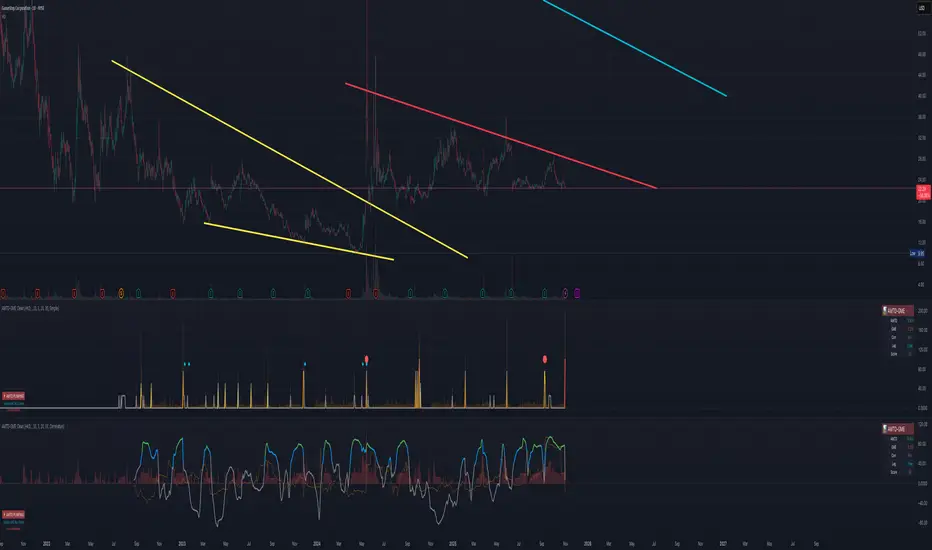
📈 AMTD-GME Clean Correlation Detector
This indicator tracks extraordinary price movements in AMTD Digital (HKD) and analyzes their correlation with GME price action. Research has shown these stocks often move together during significant market events, with GME sometimes following AMTD with a 1-3 bar delay.
━━━━━━━━━━━━━━━━━━━━━━━━━━━━━━━━━━━━━━
The indicator fetches AMTD data. It calculates multiple pump detection signals:
- Price Spike Detection: Triggers when price increases exceed threshold (default 10%)
- Volume Surge: Activates when volume exceeds average by multiplier (default 3x)
- Bollinger Band Breakout: Detects statistical anomalies with volume confirmation
- Momentum Surge: Combines RSI >70 with positive MACD
━━━━━━━━━━━━━━━━━━━━━━━━━━━━━━━━━━━━━━
VISUAL ELEMENTS EXPLAINED:
🔴 Main Line (Simple Mode):
- Red = Extreme pump (score >75)
- Orange = Moderate pump (score 50-75)
- Yellow = Weak pump (score 25-50)
- Gray = Normal conditions
📊 Orange Bars: Volume ratio multiplied by 10 for visibility. Shows when volume is unusually high.
🔵 Correlation Line (Correlation Mode):
- Shows real-time correlation coefficient (0-100%)
- Green >70% = Strong correlation
- Blue 40-70% = Moderate correlation
- Gray <40% = Weak/no correlation
━━━━━━━━━━━━━━━━━━━━━━━━━━━━━━━━━━━━━━
TABLE INDICATORS:
Status Emojis:
🚀 SYNC! = Both pumping simultaneously
⏰ DELAYED = GME following AMTD pattern
⚠️ DIVERGE = Stocks moving opposite directions
📊 NORMAL = No significant pattern
Metrics Shown:
- AMTD/GME % = Current bar price change
- Corr = 30-bar correlation coefficient
- Lag = Detected delay between AMTD and GME moves
- Score = Combined pump strength (0-100)
━━━━━━━━━━━━━━━━━━━━━━━━━━━━━━━━━━━━━━
LAG DETECTION:
The indicator analyzes if GME follows AMTD with a delay by checking correlations at different time offsets. When "Lag: 2 bars" appears, it means GME typically follows AMTD movements after 2 bars. This is crucial for timing entries.
━━━━━━━━━━━━━━━━━━━━━━━━━━━━━━━━━━━━━━
SCORING SYSTEM:
Each stock gets 0-25 points for:
- Price spike detected (+25)
- Volume surge detected (+25)
- BB breakout detected (+25)
- Momentum confirmed (+25)
Combined Score = (AMTD + GME scores)/2 + correlation bonus
- Correlation >70% adds +20 bonus
- Correlation >50% adds +10 bonus
━━━━━━━━━━━━━━━━━━━━━━━━━━━━━━━━━━━━━━
ALERTS:
1. Synchronized Pump - Both stocks pumping together
2. Delayed Pump - GME following AMTD after typical lag
3. Divergence - Correlation breaking down
4. AMTD Leading - AMTD pumping, GME hasn't yet (watch for entry)
5. Extreme Score - Combined score >80 (major event)
━━━━━━━━━━━━━━━━━━━━━━━━━━━━━━━━━━━━━━
BEST PRACTICES:
1. Use on 1-5 minute charts for pump detection
2. Watch for AMTD pumps when correlation >70%
3. If lag detected, wait X bars after AMTD pump for GME entry
4. Divergence warnings suggest correlation breakdown
5. Volume sync (both orange bars) = highest confidence
━━━━━━━━━━━━━━━━━━━━━━━━━━━━━━━━━━━━━━
SETTINGS TO ADJUST:
- Price Threshold: Lower for more sensitive detection
- Volume Multiplier: Lower to catch smaller volume spikes
- Correlation Period: Higher for longer-term correlation
- View Mode: Switch between Simple/Correlation/Advanced
Default settings optimized for intraday pump detection.
Skrip dilindungi
Skrip ini diterbitkan sebagai sumber tertutup. Akan tetapi, anda boleh menggunakannya dengan percuma dan tanpa had – ketahui lebih lanjut di sini.
Penafian
Maklumat dan penerbitan adalah tidak dimaksudkan untuk menjadi, dan tidak membentuk, nasihat untuk kewangan, pelaburan, perdagangan dan jenis-jenis lain atau cadangan yang dibekalkan atau disahkan oleh TradingView. Baca dengan lebih lanjut di Terma Penggunaan.