Levels Generator with Fibs
What does the script do?
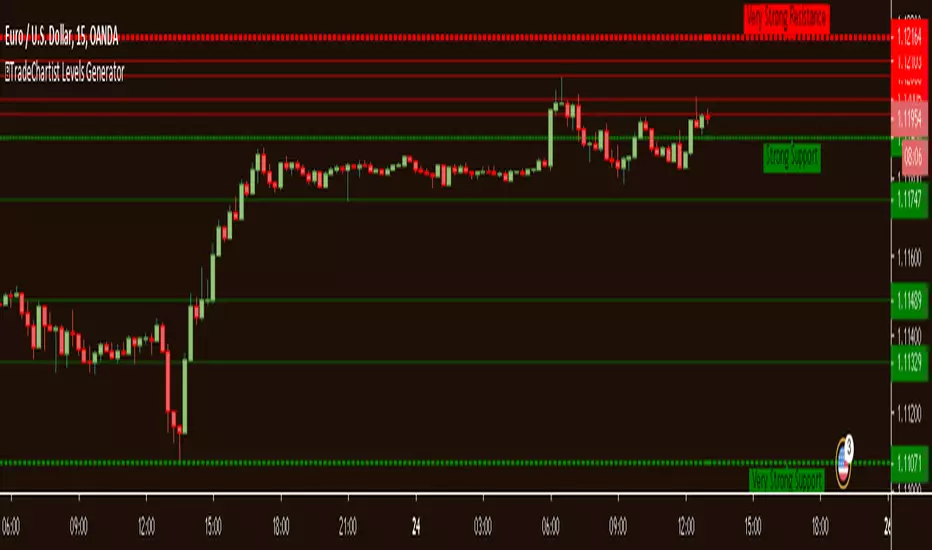
- Plots the support and resistance levels automatically based on user preference of Local or Global levels from indicator settings.
- Plots Fibonacci retracement levels between high and low based on 'Days' or 'Candles' lookback from indicator settings.
What markets can this script be used on?
- Forex
- Stocks
- Commodities
- Cryptocurrencies
- and almost any asset on Trading View
Does the script repaint levels?
No. The script does not repaint as it plots levels based on the past price movement. The only time the levels change for a given timeframe is when the price makes a new All Time High or a new All Time Low.
What is the difference between "Plot Levels" and "Plot Fibonacci Levels"?
"Plot Levels" plots support and resistance levels automatically without any input from the user other than preferred levels 'plot' from the indicator settings namely
- Plot All Global Levels - Plots all important levels from ATH to ATL (dependent on data age/availability on Trading View) - recommended for Long term outlook
- Plot Local Levels for Higher TF - Plots all important Support/Resistance levels for mostly higher time frames (1hr or higher) - Short to Mid term outlook
- Plot Local Levels for Lower TF - Plots all important Support/Resistance levels for mostly smaller time frames (can be used for up to 1hr in most cases) - Recommended for Scalping/Swing Trading mostly dependent on volatility
"Plot Fibonacci Levels" plots all standard Fibonacci retracement levels - 0, 23.6%, 38.2%, 50%, 61.8%, 78.6% and 100% based on
- "Days" Lookback - Fibonacci levels between High and Low based on number of days in the past, starting from the current day on any time frame chart
- "Candles" Lookback - Fibonacci levels between High and Low based on number of candles in the past, starting from the current candle on any time frame chart
Can the Fibonacci levels be reversed?
Yes. The Fibonacci levels can be reversed by checking the "Reverse" checkbox from the indicator settings. This is very handy if the trend looks like there may be a support or resistance from one of the Fib levels and a possibility of a new high or a new low based on the price action.
What is the need for "Plot 1.272 Fibonacci Level" under "Plot Fibonacci Levels"?
1.272 is an important Fibonacci number as it is the square root of 1.618 and is the near support or resistance after 100% price retracement. Even though it keeps moving on the chart dependent on the new high or new low based on Days/Candles lookback, it serves as a 'nice to have' reference for any trader looking beyond 100% retracement for support/resistance.
Why do the 'local levels' lines' color changes between green and red?
The nearby levels lines change color based on price closing above or below them. This happens to only closest local levels for lower TF near price action and for top/bottom lines of the local levels for higher TF.
- The line turns green when it becomes support as price closes above it.
- The line turns red when it becomes resistance as price closes below it.
Can the levels lines' colors be changed?
Yes. The color of the Higher TF levels and all Global levels (from "Plot All Global Levels") can be changed from the 'Styles' tab from the indicator settings. Some lines change between green and red (which show on both light and dark themed background), so they are not editable and are hidden, but all other lines can be edited to show /hide or change color from the 'Styles' tab on the indicator settings.
What chart background is recommended?
The colors of the levels are neutral to both light and dark background of the chart screen, but a black or a dark background shows the lines even better. It comes down to user preference. If the default horizontal and vertical lines on chart screen is of no use, it can be hidden from 'Background' tab on Trading View chart settings by increasing the transparency of the lines all the way up.
Get in touch with me if you would like access to the script on monthly, 6 monthly or annual basis.
Removed - Global levels as it is less used based on feedback and also due to the fact that Pine doesn't allow more than 64 output plots.
Skrip jemputan sahaja
Hanya pengguna disahkan oleh penulis boleh mengakses skrip ini. Anda perlu memohon dan mendapatkan kebenaran untuk menggunakannya. Keizinan selalunya diberikan selepas pembayaran. Untuk lebih butiran, ikuti arahan penulis di bawah atau hubungi TradeChartist secara terus.
TradingView TIDAK menyarankan pembayaran atau penggunaan skrip kecuali anda mempercayai sepenuhnya penulis dan memahami bagaimana ia berfungsi. Anda juga boleh menjumpai alternatif sumber terbuka dan percuma yang lain di dalam skrip komuniti kami.
Arahan penulis
Telegram - @Trade_Chartist
Free Scripts - bit.ly/Free-Scripts
Penafian
Skrip jemputan sahaja
Hanya pengguna disahkan oleh penulis boleh mengakses skrip ini. Anda perlu memohon dan mendapatkan kebenaran untuk menggunakannya. Keizinan selalunya diberikan selepas pembayaran. Untuk lebih butiran, ikuti arahan penulis di bawah atau hubungi TradeChartist secara terus.
TradingView TIDAK menyarankan pembayaran atau penggunaan skrip kecuali anda mempercayai sepenuhnya penulis dan memahami bagaimana ia berfungsi. Anda juga boleh menjumpai alternatif sumber terbuka dan percuma yang lain di dalam skrip komuniti kami.
Arahan penulis
Telegram - @Trade_Chartist
Free Scripts - bit.ly/Free-Scripts