TIL Candle Volume Heatmap
Gradient Coloring
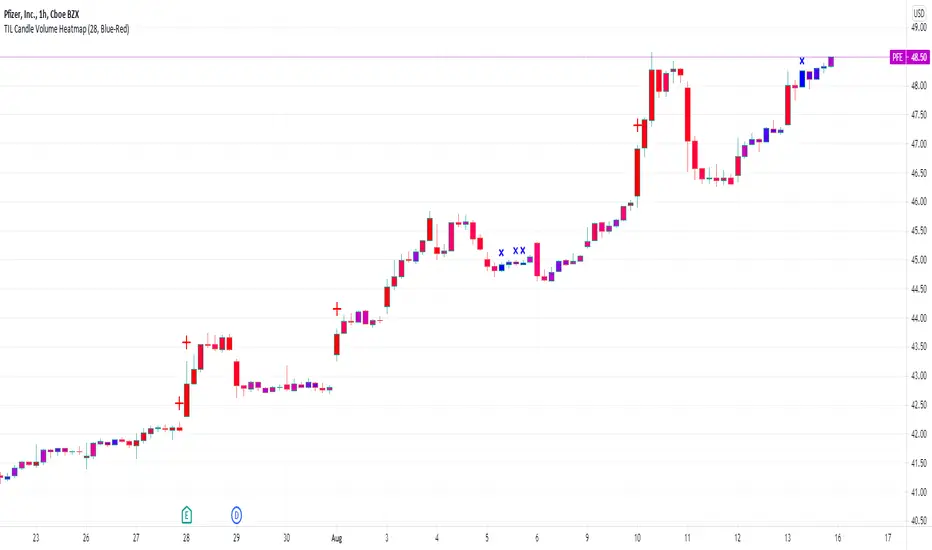
When applied to a chart, the Candle Volume Heatmap indicator applies colors to each bar which may vary according to its number of volume. The chart becomes a heatmap where you can easily spot which parts of the chart that are “hottest” or the bars that had the greatest number of volume and the “coldest” or ones that had the least volume. The indicator uses colors that transitions from BLUE to RED where shades closer to blue are “cold” (low volume) and those that are more in the shade of red are considered “hot” (high volume).
- Blue candlesticks – has low volume
- Red candlesticks – has high volume
High and Low Volume Bars
In addition to bar color changes, the Candle Volume Heatmap indicator also marks bars that have the lowest and highest volume within a certain length. Low and high-volume bars are marked as follows.
- [ x ] – Low volume bars are marked with a small cross above them signifying a very low volume. Please note that this symbol always appears in new bars which are only starting to accumulate volume.
- [ + ] – High volume bars are marked with a large plus sign above them signifying a very high volume. These bars along with other red-colored bars are the ones that should be monitored most.
Uses
Identifying low and high-volume bars can be useful in determining whether there is weight or “force” behind the price action that occurs in each bar. High volume bars can be used to validate candlestick reversal patterns and confirm breakouts in support and resistance levels.
Available Alert Conditions
- High Volume – triggers when a high-volume bar (marked with a plus sign) is detected
- Low Volume – triggers when a low-volume bar (marked with a cross sign) is detected
Inputs
- Length – sets the number of bars the indicator analyzes at each execution.
- Color Gradient – sets the color set for applying the heatmap on the chart candlesticks. Choices available are Blue-Red (good for light mode) and Yellow-Red (good for dark mode). Red color always signifies the highest concentration of volume.
- Apply Heatmap Colors – applies the color gradient on the chart candlesticks to indicate the amount of volume in each one
- Display Markers Below – moves the position of the high volume (plus) and low volume (cross) markers below the candlestick
Skrip jemputan sahaja
Hanya pengguna disahkan oleh penulis boleh mengakses skrip ini. Anda perlu memohon dan mendapatkan kebenaran untuk menggunakannya. Keizinan selalunya diberikan selepas pembayaran. Untuk lebih butiran, ikuti arahan penulis di bawah atau hubungi tradingindicatorlab secara terus.
TradingView TIDAK menyarankan pembayaran atau penggunaan skrip kecuali anda mempercayai sepenuhnya penulis dan memahami bagaimana ia berfungsi. Anda juga boleh menjumpai alternatif sumber terbuka dan percuma yang lain di dalam skrip komuniti kami.
Arahan penulis
Penafian
Skrip jemputan sahaja
Hanya pengguna disahkan oleh penulis boleh mengakses skrip ini. Anda perlu memohon dan mendapatkan kebenaran untuk menggunakannya. Keizinan selalunya diberikan selepas pembayaran. Untuk lebih butiran, ikuti arahan penulis di bawah atau hubungi tradingindicatorlab secara terus.
TradingView TIDAK menyarankan pembayaran atau penggunaan skrip kecuali anda mempercayai sepenuhnya penulis dan memahami bagaimana ia berfungsi. Anda juga boleh menjumpai alternatif sumber terbuka dan percuma yang lain di dalam skrip komuniti kami.