Gabriel's Relative Strength IndexGabriel’s RSI—The Reinvention of Relative Strength
Not your average RSI.
This is a fully reengineered Relative Strength Index that merges the power of advanced signal processing, adaptive smoothing, volume dynamics, and intelligent divergence detection into a single, modular toolkit designed for precision trading across all markets.
Whether you’re scalping crypto, swing trading equities, or dissecting futures contracts—Gabriel’s RSI adapts to your strategy with unrivaled control and clarity.
1. RSI Settings
RSI Length (Jurik): Set to 51 by default to mimic a 21-period standard RSI when Jurik smoothing is applied. Adjust lower (e.g., 22) to mimic a 9-period RSI.
RSI Source: The default is hlc3 for smoother RSI inputs. Can be changed to any price-based series (close, open, etc.) for customization.
2. RSI Smoothing Options
MA Type: Smoothing applies to both RSI and its MA overlay simultaneously. I used to use the 56 EMA RSI, and it works well too.
JMA: Best for adaptive recursive smoothing. A power of 2 and a phase of 50 are used.
T3: Smooth and lag-reduced, suitable for trend detection. The alpha is 0.7.
SMA + Bollinger Bands: Adds deviation-based envelopes for volatility spotting.
MA Length: Affects how smooth or reactive the RSI signal is.
BB StdDev: Only relevant if BBs are used. Controls bandwidth for overbought/oversold zones.
3. MACD Settings
Fast/Slow Length: Defaults (21/81) optimized for smoother MACD with SMA or T3. For Algo trading, EMA/JMA is best.
Signal Length: Shorter (e.g., 2) gives more reactive crossover signals, it can be increased.
Source: Default is close. Close works best for the settings I input.
MA Types: JMA and EMA reduce noise and increase signal generation. Select SMA for simplicity or T3 for trend-following.
Histogram: Bar colors signal strength and trend of MACD directly on your chart.
4. Directional Movement Index (DMI)
ADX Smoothing: High values (e.g., 100) offer strong trend confirmation with Hann Window smoothing.
DI Length: Affects DI+/- sensitivity. 100 ADX - 12 DI or 15 ADX - 35 DI are suggested, the latter for quicker boot time, as 100 bars is quite long.
Smoothing Type: Choose Hann Window for refined smoothing; RMA (SMMA) for simplicity.
Volatility Type: ATR includes gaps; ADR is useful for gapless strategies.
Plotted as area fills, 0 to 100 scaled.
5. Volume Z-Score
%R Length: Normalizes volume to percentile range (73 swing, 112 exhaustion).
Z-Score Lengths: Compares short-term and long-term volume trends with Z-scores of volume.
Fast Z-Score < Slow Z-Score = Gives a Volume Squeeze.
Fast MA > Slow MA = Bullish Volume Divergence; volume has been fired. Not via Z-score, but instead via SMA, ALMA, and RMA of volume.
WPR Volume: Weighted %R used to highlight exhaustion/pivot points.
Plot volume bars after a volume squeeze has been fired; if bars aren't plotted, then it's under squeeze. Backtest on ES1! Prove it's good for catching bottoms below 15 minutes as well.
6. Divergence Engine
Pivot Settings: Pivot Period (12), Divergence minval Lookback (5), and max Lookback Bars (100) control sensitivity. Works well on any asset class; these are the optimal settings for the RSI.
Source Options: RSI, MACD, ADX, DI difference, or Volume %R.
Divergence Type:
Regular: Classic reversal signals.
Hidden: Continuation signals.
Heikin Ashi Mode: Enables use of HA candles on normal charts for smoother pivots. May distort values if your chart is H.A. so leave it unchecked then.
7. Squeeze Momentum (SQZMOM)
Squeeze Types:
Wide (Black): Regular compression
Normal (Red), Regular Squeeze
Narrow (Yellow), Golden Squeeze
Very Narrow (Purple) Extreme compression
Fired (Green): Breakout detected
Plotted as circles on the bottom of my indicator.
Momentum Bar Colors:
Cyan: Rising momentum
Blue: Pullback within uptrend
Red: Falling momentum
Yellow: Correction within downtrend
Reversal Lines: Dashed lines indicate momentum crossing its Jurik MA (DM-Style Pivots).
Plotted as squares on the top of my indicator.
8. Rate of Change (RoC)
RoC of Momentum: EMA-smoothed RoC on momentum for leading signals. Double smoothed, once and then another time for smoother signals.
Signal Line: JMA used to filter noise and generate reversal signals.
Crossovers: Bullish/bearish signals based on RoC vs signal line are plotted as triangles directly on your chart.
Optimized: Backtested for short-term setups like 1H or faster. Works on Daily timeframes as well for Futures.
9. Multi-Timeframe Squeeze Settings
Each timeframe (Hourly, 4H, Daily, Weekly, Monthly) has:
Reversal Toggle: Enables dashed line DM-Style Pivots on crossovers.
MA Length: For Jurik MA smoothing on momentum.
BB/KC Thresholds: Define squeeze sensitivity per timeframe. A shorter BB/KC length, 17-14-12, responds better on lower timeframes.
Momentum Length: Tailors oscillator responsiveness; 20 is ideal.
10. BB Std. Deviation Scaling
Low-Pass Super Smoother : Smooths (True Range) noise for BBs.
High-Pass Butterworth : Extracts cycles for BB Stdv. blend.
Root Mean Squared : Dynamic BB width adjustment based on market activity.
11. Alerts
RSI: Overbought/oversold reversals. Several types.
MACD: Histogram shift through zero line.
DMI/ADX: Crossovers and strength conditions. The 17 key level is used for the ADX.
Volume: Smart Money alerts on low-volume zones. May concentrate on ICT sessions.
Squeeze: Alerts on all 5 squeeze states.
Momentum: Crosses and reversals.
RoC: Bullish and bearish crosses.
Divergences: Regular, hidden, combined.
12. Visual Output Summary
RSI Line + MA/BBs
MACD Histogram Bar Colors
DMI/ADX as area fills
Volume %R columns
Squeeze Momentum Shapes and Dots
RoC Crossover Arrows
DM-style Breakout Pivots
Divergence Lines and Labels
Best Practices
Watch the slope of the RSI for pullbacks on a strong trend. Combine it with squeeze for exit timing.
Combine RSI Divergence with MACD histogram cross and Squeeze firing for precise entry.
Use Volume Z-Score to filter for institutional activity, and enter Long. Watch for reversals as well.
Watch RoC crossovers for fast, leading signals.
Enable Reversal Lines on 1H+ charts for breakout or breakdown pivots.
Use multi-timeframe thresholds for swing confirmation. The TFs I use the most are 2-5-15 minutes for futures and swinging with 1 hour daily and weekly. Those are the TFs I backtested.
Volumepriceanalysis

Volumatic Support/Resistance Levels [BigBeluga]🔵 OVERVIEW
A smart volume-powered tool for identifying key support and resistance zones—enhanced with real-time volume histogram fills and high-volume markers.
Volumatic Support/Resistance Levels detects structural levels from swing highs and lows, and wraps them in dynamic histograms that reflect the relative volume strength around those zones. It highlights the strongest price levels not just by structure—but by the weight of market participation.
🔵 CONCEPTS
Price Zones: Support and resistance levels are drawn from recent price pivots, while volume is used to visually enhance these zones with filled histograms and highlight moments of peak activity using markers.
Histogram Fill = Activity Zone: The width and intensity of each filled zone adjusts to recent volume bursts.
High-Volume Alerts: Circle markers highlight moments of volume dominance directly on the levels—revealing pressure points of support/resistance.
Clean Visual Encoding: Red = resistance zones, green = support zones, orange = high-volume bars.
🔵 FEATURES
Detects pivot-based resistance (highs) and support (lows) using a customizable range length.
Wraps these levels in volume-weighted bands that expand/contract based on percentile volume.
Color fill intensity increases with rising volume pressure, creating a live histogram feel.
When volume > user-defined threshold , the indicator adds circle markers at the top and bottom of that price level zone.
Bar coloring highlights the candles that generated this high-volume behavior (orange by default).
Adjustable settings for all thresholds and colors, so traders can dial in volume sensitivity.
🔵 HOW TO USE
Identify volume-confirmed resistance and support zones for potential reversal or breakout setups.
Focus on levels with intense histogram fill and circle markers —they indicate strong participation.
Use bar coloring to track when key activity started and align it with broader market context.
Works well in combination with order blocks, trend indicators, or liquidity zones.
Ideal for day traders, scalpers, and volume-sensitive setups.
🔵 CONCLUSION
Volumatic Support/Resistance Levels elevates traditional support and resistance logic by anchoring it in volume context. Instead of relying solely on price action, it gives traders insight into where real conviction lies—by mapping how aggressively the market defended or rejected key levels. It's a visual, reactive, and volume-conscious upgrade to your structural toolkit.

Volume Spike Alert & Overlay"Volume Spike Alert & Overlay" highlights unusually high trading volume on a chart. It calculates whether the current volume exceeds a user-defined percentage above the historical average and triggers an alert if it does. The information is also displayed in a customizable on-screen table.
What It Does
Monitors volume for each bar and compares it to an average over a user-defined lookback period.
Supports multiple smoothing methods (SMA, EMA, WMA, RMA) for calculating the average volume.
Triggers an alert when current volume exceeds the threshold percentage above the average.
Displays a table on the chart with:
Current Volume
Average Volume
Threshold Percentage
Optional empty row for spacing/formatting
How It Works
User Inputs:
lookbackPeriods: Number of bars used to calculate the average volume.
thresholdPercent: % above the average that triggers a volume spike alert.
smoothingType: Type of moving average used for volume calculation.
textColor, bgColor: Formatting for the display table.
tablePositionInput: Where the table appears on the chart (e.g., Bottom Right).
Toggles for showing/hiding parts of the table.
Volume Calculations:
Calculates current bar's volume.
Calculates average volume using the selected smoothing method.
Computes the threshold: avgVol * (1 + thresholdPercent / 100).
Compares current volume to threshold.
Table Display:
Dynamically creates a table with volume stats.
Adds rows based on user preferences.
Alerts:
alertcondition fires when currentVol crosses above the calculated threshold.
Message: "Volume Threshold Exceeded"
Usage Examples
Example 1: Spotting High Activity
Apply the script to a stock like AAPL on a 5-minute chart.
Set lookbackPeriods to 20 and thresholdPercent to 30.
Use EMA for more reactive volume tracking.
When volume spikes more than 30% above the 20-period EMA, an alert triggers.
Example 2: Day Trading Filter
For scalpers, apply it to a 1-minute crypto chart (e.g., BTC/USDT).
Set thresholdPercent to 50 to catch only strong surges.
Position the table at the top left and reduce visible info for a clean layout.
Example 3: Long-Term Context
On a daily chart, use SMA and set lookbackPeriods to 50.
Helps identify breakout moves supported by strong volume.
How this is different from Trading View's Volume indicator:
The standard volume plot from trading view allows users to set a alert when the average line is crossed, but it does not allow you to set a custom percentage at which to trigger an alert. This indicator will allow you to set any percentage you wish to monitor and above that percentage threshold will trigger your alert.
===== ORIGINAL DESCRIPTION =====
Volume Spike Alert & Overlay
This indicator will display the following as an overlay on your chart:
Current volume
Average Volume
Threshold for Alert
Description:
This indicator will display the current bar volume based on the chart time frame,
display the average volume based on selected conditions,
allow user selectable threshold over the average volume to trigger an alert.
Options:
Average lookback period
Smoothing type
Alert Threshold %
Enable / Disable Each Value
Change Text Color
Change Background Color
Change Table location
Add/Remove extra row for placement in top corner
Usage Example:
I use this indicator to alert when the current volume exceeds the average volume by a specified percentage to alert to volume spikes.
Set the threshold to 25% in the settings
Create an alert by clicking on the 3 dots on the right of the indicator title on the chart
When the threshold is exceeded the alert will trigger

Multi-TF Volume & Price Analysis[BullByte]This indicator offers a comprehensive view of market dynamics by combining volume and price analysis across multiple timeframes. It calculates key metrics—such as bullish/bearish volume percentages, relative volume (RVol), cumulative volume delta (CVD), and price change percentages—for each timeframe that you choose (for example, 1, 3, 5, and 15 minutes). Here are the main features in simple terms:
- Multi-Timeframe Analysis:
The tool analyzes volume and price action from four different timeframes simultaneously. This means you get insights from short-term and slightly longer-term trends in one view.
- Volume Breakdown:
It splits the volume into bullish and bearish parts by comparing closing and opening prices. This helps you see how much of the trading volume is driving the market upward versus downward.
- Relative Volume & Spike Detection:
It calculates relative volume (current volume compared to a moving average) and flags any significant volume spikes based on a customizable multiplier. This feature helps identify unusual trading activity.
- Volume Smoothing Option:
For a cleaner signal, you can enable a smoothing option (using an exponential moving average) to reduce noise in the volume data.
- Advanced Summary:
The indicator combines volume data, price changes, and volume spikes to produce an overall market summary for each timeframe—labeling conditions as “Bullish Strong,” “Bullish Moderate,” “Bearish Strong,” “Bearish Moderate,” or “Neutral.”
- Cumulative Overview:
In addition to individual timeframe analysis, it aggregates the data to offer a cumulative view. This includes a collective bullish/bearish percentage, overall CVD, and even a simplified volume level (Low, Normal, or High).
- Customizable Dashboard:
All these metrics are neatly displayed in a dashboard on the chart. You can customize its position and text size. The dashboard uses dynamic, color-coded cells to instantly convey the market sentiment—making it easy to spot trends at a glance.
- VWAP Integration:
Finally, the dashboard includes VWAP information, providing an additional layer of context to the price action.
Overall, this indicator is designed to provide a quick yet thorough snapshot of market conditions, enabling traders to make more informed decisions with a clear visual representation of volume and price activity across different timeframes.

Volume Pro Indicator## Volume Pro Indicator
A powerful volume indicator that visualizes volume distribution across different price levels. This tool helps you easily identify where trading activity concentrates within the price range.
### Key Features:
- **Volume visualization by price levels**: Green (lower zone), Magenta (middle zone), Cyan (upper zone)
- **VPOC (Volume Point of Control)**: Shows the price level with the highest volume concentration
- **High and Low lines**: Highlights the extreme levels of the analyzed price range
- **Customizable historical analysis**: Configurable number of days for calculation
### How to use it:
- Colored volumes show where trading activity concentrates within the price range
- The VPOC helps identify the most significant price levels
- Different colors allow you to quickly visualize volume distribution in different price areas
Customizable with numerous options, including analysis period, calculation resolution, colors, and visibility of different components.
### Note:
This indicator works best on higher timeframes (1H, 4H, 1D) and liquid markets. It's a visual analysis tool that enhances your understanding of market structure.
#volume #vpoc #distribution #volumeprofile #trading #analysis #indicator #professional #pricelevels #volumedistribution

Dual Volume Divergence LineDual Volume Divergence Line (DVD/Line)
🔹 Overview
The Dual Volume Divergence Line (DVD/Line) is a custom Pine Script™ indicator designed to identify potential trend reversals and continuations by analyzing volume and price divergences. This script is inspired by the original concept of the Dual Volume Divergence Index (DVDI) by DonovanWall and has been modified and enhanced by keremertem. Special thanks to DonovanWall for the original concept. The indicator combines volume-based calculations with price action to generate signals for bullish and bearish divergences, both normal and hidden. Below is a detailed breakdown of its components and functionality.
🔹 Key Features of the DVD/Line Indicator
1. Dual Volume Divergence Calculation:
- The indicator calculates two primary volume-based indices: the Positive Volume Index (PVI) and the Negative Volume Index (NVI).
- PVI measures the impact of volume on price when the price increases, while NVI measures the impact when the price decreases.
- These indices are used to detect divergences between volume and price, which can signal potential reversals or continuations.
2. Customizable Inputs:
- DVD Sampling Period: Adjusts the sensitivity of the indicator by controlling the lookback period for calculating the volume-weighted moving averages (VWMA) of PVI and NVI.
- Band Width: Defines the range for calculating the upper and lower bands, which act as dynamic support and resistance levels.
- Source: Allows users to select the price source (e.g., `hlc3`, `close`, etc.) for calculations.
3. Volume-Weighted Moving Averages (VWMA):
- Instead of using traditional moving averages, the script employs VWMA to smooth the PVI and NVI signals. This ensures that the indicator is more responsive to changes in volume.
4. Upper and Lower Bands:
- The upper and lower bands are calculated using the Root Mean Square (RMS) of the highest and lowest values of the DVD line over a user-defined period. These bands help identify overbought and oversold conditions.
5. Divergence Detection:
- The script identifies four types of divergences:
- Normal Bullish Divergence: Occurs when price makes a lower low, but the DVD line makes a higher low.
- Hidden Bullish Divergence: Occurs when price makes a higher low, but the DVD line makes a lower low.
- Normal Bearish Divergence: Occurs when price makes a higher high, but the DVD line makes a lower high.
- Hidden Bearish Divergence: Occurs when price makes a lower high, but the DVD line makes a higher high.
- These divergences are visually highlighted on the chart using labels.
6. Customizable Divergence Selection:
- Users can choose between two types of divergence calculations:
- DVDI: Based on the raw divergence values.
- DVD Line: Based on the smoothed DVD line.
7. Visual Enhancements:
- The DVD line is plotted with a color-coded scheme: blue when the DVD line is above its signal line (bullish) and pink when it is below (bearish).
- The upper and lower bands are displayed as step lines, making it easier to identify key levels.
🔹 How the Indicator Works
1. Volume-Based Calculations:
- The script starts by calculating the PVI and NVI based on the selected price source and volume data.
- PVI increases when the price rises, while NVI decreases when the price falls. These indices are then smoothed using VWMA to generate signals.
2. DVD Line Calculation:
- The DVD line is derived by combining the divergences of PVI and NVI. It is further smoothed using a Weighted Moving Average (WMA) and a linear regression line for trend analysis.
3. Divergence Detection:
- The script identifies pivot points in the DVD line and compares them with price action to detect divergences.
- Normal divergences indicate potential reversals, while hidden divergences suggest trend continuations.
4. Dynamic Bands:
- The upper and lower bands are calculated using RMS, which provides a more accurate representation of volatility compared to standard deviation or fixed-width bands.
5. Labeling:
- Divergences are labeled directly on the chart with clear text and color coding:
🟢 Bullish Divergence: Green label with "Bull".
🟩 Bearish Divergence: Red label with "Bear".
🔴 Hidden Bullish Divergence: Lime label with "hid.".
🟧 Hidden Bearish Divergence: Orange label with "hid.".
🔹 Unique Aspects of This Script
1. Volume-Weighted Smoothing:
- Unlike traditional divergence indicators that rely on simple moving averages, this script uses VWMA and WMA to ensure that volume plays a significant role in signal generation.
2. Dynamic Bands with RMS:
- The use of RMS for calculating bands provides a more adaptive and accurate representation of market conditions, especially in volatile markets.
3. Flexible Divergence Selection:
- Users can choose between raw divergence values (DVDI) or smoothed values (DVD Line), allowing for greater customization based on trading style.
4. Comprehensive Divergence Detection:
- The script detects both normal and hidden divergences, providing a complete picture of potential trend reversals and continuations.
5. User-Friendly Visuals:
- The color-coded DVD line and cross-style bands make it easy to interpret the indicator at a glance.
🔹 How to Use the Indicator
1. Trend Identification:
- Use the Middle Band and its color to identify the current trend. A green line suggests bullish momentum, while a red line indicates bearish momentum. Additionally, a bullish momentum may be indicated when the DVD line crosses up, and a bearish momentum may be indicated when it crosses down the Middle Band.
2. Divergence Trading:
- Look for divergences between the DVD line and price action. Normal divergences can be used for counter-trend trades, while hidden divergences can confirm trend continuations.
3. Band Breakouts:
- Monitor the upper and lower bands for potential breakout or reversal signals. A break above the upper band may indicate overbought conditions, while a break below the lower band may suggest oversold conditions.
4. Customization:
- Adjust the sampling period and band width to suit different timeframes and trading strategies. Shorter periods are more sensitive, while longer periods provide smoother signals.
🔹 Conclusion
The Dual Volume Divergence Line (DVD/Line) is a powerful and versatile indicator that combines volume analysis with price action to generate actionable trading signals. Its unique use of volume-weighted smoothing, dynamic bands, and comprehensive divergence detection sets it apart from traditional divergence indicators. Whether you're a day trader or a long-term investor, this tool can help you identify high-probability trading opportunities with greater accuracy and confidence.
📌 Disclaimer: This script is for educational purposes only and does not constitute financial advice. Always conduct your own analysis before making trading decisions.

PVSRA Volume Suite with Volume DeltaPVSRA Volume Suite with Volume Delta
🔹 Overview
This indicator is a Volume Suite that enhances PVSRA (Price, Volume, Support, Resistance Analysis) by incorporating Volume Delta and AI-driven predictive alerts. It is designed to help traders analyze volume pressure, market trends, and price movements with color-coded visualizations.
📌 Key Features
PVSRA Volume Color Coding – Highlights vector candles based on extreme volume/spread conditions.
Volume Delta Analysis – Tracks buying/selling pressure using up/down volume data.
AI-Powered Predictive Alerts – Identifies potential trend shifts based on volume and trend context.
Volatility-Adjusted Thresholds – Dynamically adapts volume conditions based on ATR (Average True Range).
Customizable MA & Symbol Overrides – Allows traders to tweak settings for personalized market insights.
Debug & Diagnostic Labels – Shows statistical z-scores, thresholds, and volume dynamics.
How It Works
PVSRA Color Coding – The script classifies candles into four categories based on volume and spread analysis:
🔴 Red Vector → Extreme bearish volume/spread
🟢 Green Vector → Extreme bullish volume/spread
🟣 Violet Vector → Above-average bearish volume
🔵 Blue Vector → Above-average bullish volume
Volume Delta Calculation – Uses lower timeframe volume analysis to estimate up/down volume differentials.
Trend & Predictive Alerts – Combines EMA crossovers with statistical volume analysis to detect potential trend shifts.
Volatility Adaptation – Adjusts volume thresholds based on ATR, making signals more reliable in changing market conditions.
Custom Symbol Override – Fetches PVSRA data from a different instrument, useful for index-based volume analysis.
Customizable Inputs
PVSRA Color Settings – Modify candle color schemes for better visual clarity.
Volume Delta Colors – Customize delta volume body, wick, and border colors.
AI Settings – Tune z-score thresholds, lookback periods, and enable predictive alerts.
Symbol Overrides – Analyze volume from a different market or asset.
Moving Average (MA) Settings – Display a volume-based moving average for trend confirmation.
Important Notes
Works best on intraday timeframes where volume data is reliable.
Lower timeframe volume delta estimates might not be precise for all assets.
No guarantees of accuracy – Use alongside other confluence tools for decision-making.
Credits & Open-Source Notice
This script is based on PVSRA methodologies and integrates Volume Delta analysis. Special thanks to Traders Reality and TradingView for their contributions to volume-based analysis.

Volume Width Based Candles
Overview
This indicator reimagines traditional candlestick charts by adjusting the horizontal width of each candle based on the bar’s trading volume. In other words, candles with higher volume appear wider, while those with lower volume are drawn narrower. This extra visual dimension can help traders quickly identify bars with significant volume relative to a defined lookback period.
Key Components
Volume Normalization:
The script calculates the highest volume over a user-defined lookback period (default is 100 bars).
Each bar’s volume is then normalized by dividing it by this maximum value. The result is a value between 0 and 1 that represents how the current volume compares to the maximum over the lookback.
Variable Candle Width Calculation:
A base multiplier (default set to 0.4) is used to control how much the volume influences the candle width.
The normalized volume is multiplied by this multiplier to compute an offset value.
Instead of using timestamps (which could lead to drawing objects too far into the future), the script uses the bar_index (the sequential index of bars) to determine the left and right positions of each candle.
The left and right x–positions are calculated by subtracting and adding the offset from the current bar index, respectively.
Candle Body & Wick Drawing:
Candle Body:
The body is drawn using box.new as a rectangle.
The top and bottom of the box are determined by the higher and lower values of the open and close prices.
The color of the candle is set based on whether the bar is bullish (green) or bearish (red).
Wicks:
The upper wick is drawn from the high of the bar down to the top of the body.
The lower wick is drawn from the low up to the bottom of the body.
These are created using line.new at the current bar index.
Handling Edge Cases:
The indicator includes conditions to avoid drawing errors on the very first bar (or any bar where prior data is unavailable).
It also converts the calculated x–coordinates (which are derived from the bar index plus a floating point offset) to integers since box.new requires integer values for positioning.
What It Tells the Trader
Volume Visualization:
Wider candles indicate bars where trading volume is high relative to recent history, potentially highlighting periods of increased market activity.
Narrower candles suggest lower volume, which can signal less interest or participation during that bar.
Contextual Price Action:
By integrating volume into the visual representation of each candle, traders get an immediate sense of the strength behind price movements.
This can be particularly useful for spotting potential breakouts, reversals, or confirming trends when analyzed alongside traditional price-based indicators.
Customization Options
Volume Lookback Period:
You can adjust the number of bars considered when determining the maximum volume. A shorter period may be more responsive to recent changes, while a longer period provides a broader context.
Base Width Multiplier:
Adjusting this multiplier changes how pronounced the effect of volume is on the candle’s width. Increasing it will make high-volume candles even wider, and decreasing it will reduce the difference between high and low volume candles.
Final Thoughts
This indicator is a creative way to overlay volume information directly onto the price chart without the need for separate volume bars. It provides an at-a-glance understanding of market activity and can be a valuable addition to a trader’s toolkit, especially for those who prefer visual cues integrated with price action. However, due to limitations (like the maximum number of drawn boxes), it’s best used on charts with a moderate amount of historical data or with appropriate adjustments to manage performance.

Liquidity Depth [AlgoAlpha]OVERVIEW
This script visualizes market liquidity by identifying key price levels where significant volume has transacted. It highlights zones of high buying and selling interest, helping traders understand where liquidity is accumulating and how price may respond to these areas. By dynamically tracking volume at highs and lows, the script builds a real-time liquidity profile, making it a powerful tool for identifying potential support and resistance levels.
CONCEPTS
Liquidity depth analysis helps traders determine how price interacts with supply and demand at different levels. The script processes historical volume data to distinguish between high-liquidity and low-liquidity zones. It assigns transparency levels to plotted lines , ensuring that more relevant liquidity areas stand out visually. The script adds a profile to show the depth of liquidity (derived from historical volume data) for levels above and below the current price
FEATURES
Liquidity Levels: Tracks liquidity levels based on volume concentration at price high and lows.
Volume-Based Transparency: More significant liquidity levels are displayed with higher visibility, showing their significance.
Interpolation: interpolates the bullish and bearish liquidity depth at a user defined range away from the price, helping in comparing the liquidity amounts between bullish and bearish.
Depth Profile: Allows traders to visualize depth of liquidity in a more quantitative and clearer way than the liquidity levels/list]
USAGE
This indicator is best used to track liquidity levels and potential price reaction areas. Traders can adjust the Liquidity Lookback setting to analyze past liquidity levels over different historical periods. The Profile Resolution setting controls the granularity of liquidity depth visualization, with higher values providing more detail. The script can be applied across different timeframes, from intraday scalping to swing trading analysis. The plotted liquidity zones provide traders with insights into where price may encounter strong support, resistance, or potential liquidity-driven reversals.

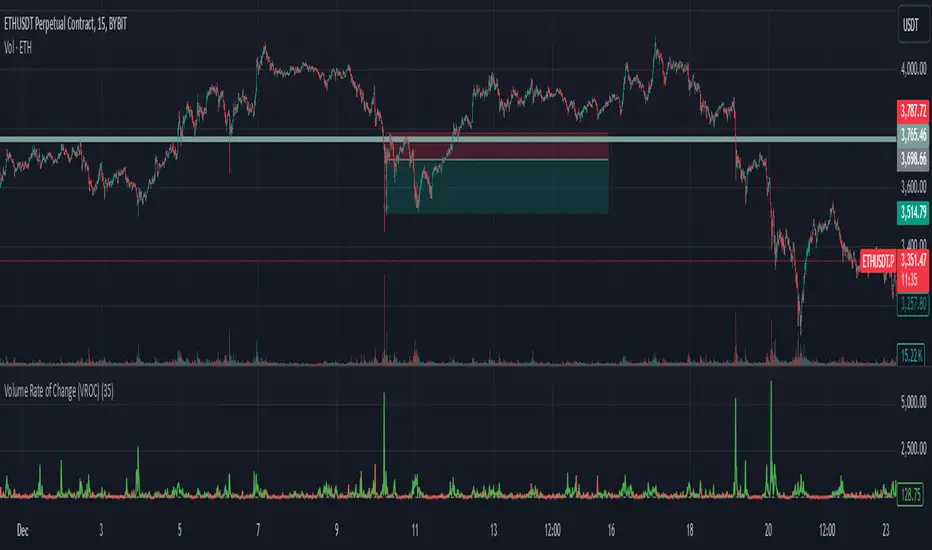
Fibonacci Volume Profiles [AlgoAlpha]Unlock a deeper understanding of price action with the Fibonacci Volume Profiles indicator by AlgoAlpha! This powerful tool blends Fibonacci retracement levels with customizable volume profiles, helping traders identify high-probability areas of support, resistance, and accumulation. Designed for both continuous dynamic levels and custom time periods, this indicator is a must-have for traders seeking confluence in market structure analysis.
🔑 Key Features
📈 Dual Mode Selection : Choose between Continuous Fibonacci levels, which adapt dynamically to pivots, or a Custom Period mode, where you set your own start and end points.
📊 Integrated Volume Profile : Visualize volume distributions at key Fibonacci retracement levels, revealing areas of strong buying/selling interest.
🎨 Customizable Colors & Transparency : Adjust Fibonacci level colors, fill zones, and profile transparency for a visually clear experience.
🔍 Profile Resolution & Scaling : Control the number of price levels and width of the volume profile for detailed market insights.
🛠 Extendable Levels : Optionally extend Fibonacci levels to the right of the chart for better visualization of future price interaction.
📌 How to Use
Add the Indicator: Click on the star icon to add it to your favorites and apply it to your TradingView chart.
Analyze The Market: Observe how price interacts with Fibonacci levels alongside the volume profile to confirm support/resistance zones. Switch between custom range or continuous mode to align the tool with your trading style.
⚙️ How It Works
The indicator calculates pivot highs/lows dynamically (or uses user-defined time periods) to plot Fibonacci retracement levels. It then builds a volume profile by analyzing historical volume data, grouping it into price bins to highlight volume-heavy zones. The Point of Control (PoC) is identified as the level with the highest traded volume, acting as a key price magnet. The color-coded Fibonacci levels help traders spot retracement zones, while the volume profile confirms strength or weakness in those areas.

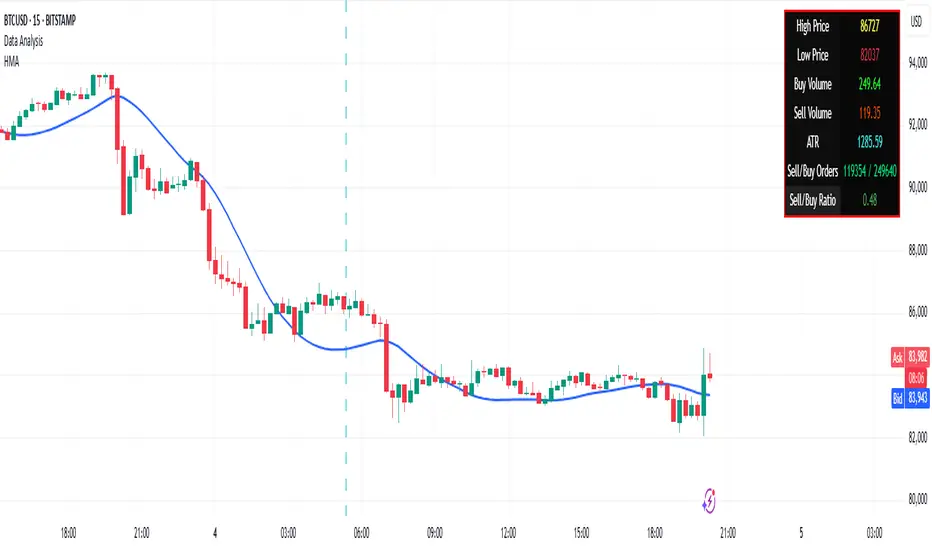
Volume Data Customized TimeframeThe "Volume Data Customized Timeframe" (VolData CTF) indicator provides traders with an enhanced volume analysis tool that aggregates buy and sell volume over a user-defined timeframe. It enables a comparative assessment of bullish and bearish volume trends, offering deeper insights into market sentiment. The indicator features a customizable display table with user-selectable themes and positioning, providing essential volume metrics for improved trading decisions.
1. Introduction:
The "Volume Data Customized Timeframe" indicator is designed to help traders analyze volume trends across different timeframes. It allows users to customize the period for volume calculations, view the ratio of selling to buying volume, and present the data in a user-friendly table format.
2. Features:
Selectable timeframe for volume analysis (default: chart timeframe)
Calculation of bullish (buy) and bearish (sell) volume
Customizable table size, theme, and positioning
Displays key volume metrics:
Total Buy Volume
Total Sell Volume
Sell/Buy Volume Ratio
Analysis period in minutes, days, weeks, or months
3. Indicator Inputs:
Average Volume Lookback (n): Number of bars used to calculate volume statistics.
Select Timeframe: Custom timeframe for volume calculations (leave empty to use the chart's timeframe).
Table Size: Choose from Small, Medium, or Big to adjust text size.
Table Theme: Choose between Light and Dark themes.
Table Position: Place the table in any corner of the chart (top-left, top-right, bottom-left, bottom-right).
4. How It Works:
The indicator retrieves volume data for the selected timeframe.
It aggregates bullish and bearish volume based on the lookback period.
The sell-to-buy volume ratio is calculated and color-coded (green for bullish dominance, red for bearish dominance).
The volume statistics are displayed in a customizable table for easy reference.
5. Interpretation:
Δ BUY VOL: Represents the total volume of bullish (up-closing) bars within the lookback period.
Δ SELL VOL: Represents the total volume of bearish (down-closing) bars within the lookback period.
Δ SELL/Δ BUY: The ratio of bearish to bullish volume; values above 1 indicate more selling pressure, while values below 1 indicate buying dominance.
Period (M/D/W/M): Displays the selected timeframe for volume aggregation.
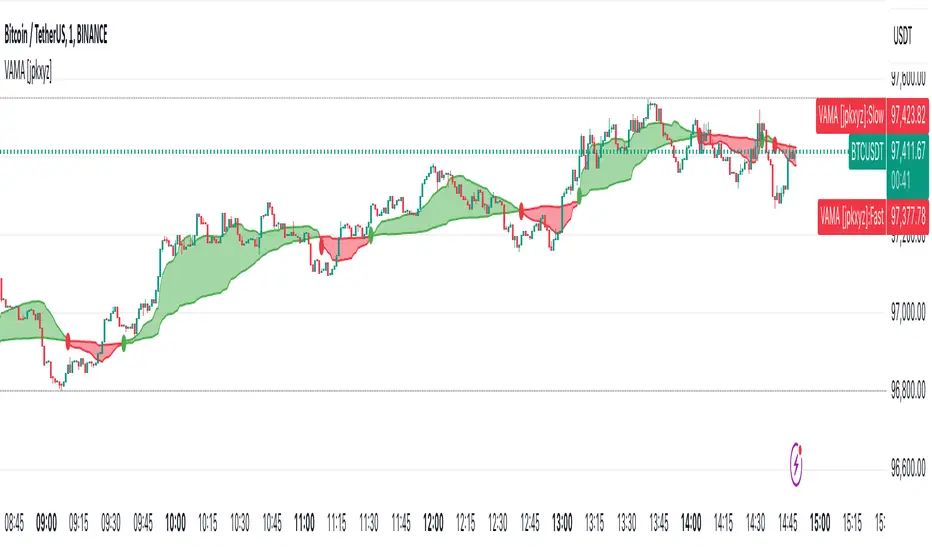
VAMA - Volume Adjusted Moving Average [jpkxyz]VAMA is a moving average that adapts to volume, giving more weight to price movements backed by higher relative volume. This VAMA (Volume Adjusted Moving Average) indicator implementation emphasizes visual clarity. It is based on the VAMA script by @allanster
Dual VAMA lines (Fast/Slow) with dynamic coloring:
Single-color scheme switches between green (bullish) and red (bearish)
Color changes on crossovers rather than relative position
Configurable line widths (set to 1 for clean appearance)
Visual enhancements:
Optional fill between VAMA lines (50% transparency)
Crossover dots can be toggled
Fills and dots match the current trend color
Customization parameters:
Independent source inputs for Fast/Slow lines
Adjustable VI Factor (volume influence)
Sample size control
Strict/non-strict calculation toggle
The code maintains efficient computation while prioritizing visual feedback for trend changes. It's designed for clear signal identification without visual clutter.
Notable style choices:
Consistent color theming throughout all visual elements
Simplified color transitions (only at crossovers)
Subtle transparency for fill areas
Minimal dot size for crossover markers
VAMA (Volume Adjusted Moving Average) Technical Analysis:
Core Calculation:
1. Volume Influence (v2i):
v2i = volume / ((total_volume/total_periods) * volume_factor)
- total_volume: Sum of volume over sample period
- total_periods: Either full history (nvb=0) or specified sample size
- volume_factor: Controls sensitivity to volume deviation
2. Price Weighting:
weighted_price = source_price * v2i
3. Accumulation Process:
- Iterates through length*10 periods
- Accumulates weighted prices and volume influence values
- Continues until volume influence sum >= specified length or strict rule triggers
4. Final VAMA Value:
vama = (weighted_sum - (volume_sum - length) * last_price) / length
Parameters:
- SampleN: Historical reference length (0=full history)
- Length: Base period for calculation
- VI Factor: Volume influence multiplier (>0.01)
- Strict: Forces exact length period completion when true
- Source: Input price data
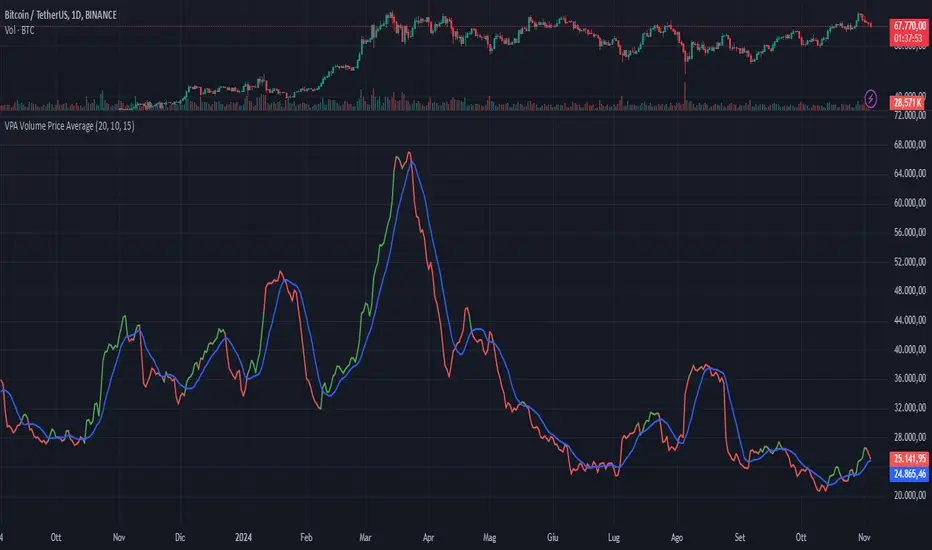
VPA Volume Price AverageDescription:
This indicator displays a moving average of volume and its signal line in a separate pane, with conditional highlighting to help interpret buyer and seller pressure. It’s based on two main lines:
Volume Moving Average (red line) : represents the average volume calculated over a configurable number of periods.
Signal Line of the Volume Moving Average (blue line): this is an average of the volume moving average itself, used as a reference for volume trends.
Key Features
Volume Moving Average with Conditional Highlighting:
The volume moving average is plotted as a red line and changes color based on two specific conditions:
The closing price is above its moving average, calculated over a configurable number of periods, indicating a bullish trend.
The volume moving average is greater than the signal line, suggesting an increase in buyer pressure.
When both conditions are met, the volume moving average turns green. If one or both conditions are not met, the line remains red.
Signal Line of the Volume Moving Average:
The signal line is plotted in blue and represents a smoothed version of the volume moving average, useful for identifying long-term volume trends and as a reference for the highlighting condition.
Customizable Periods
The indicator allows you to set the periods for each average to adapt to different timeframes and desired sensitivity:
Period for calculating the volume moving average.
Period for calculating the signal line of the volume moving average.
Period for the price moving average (used in the highlighting condition).
How to Use
This indicator is especially useful for monitoring volume dynamics in detail, with a visual system that highlights conditions of increasing buyer strength when the price is in an uptrend. The green highlight on the volume moving average provides an intuitive signal for identifying potential moments of buyer support.
Try it to gain a clearer and more focused view of volume behavior relative to price movement!
Enhanced volumeHi all!
This indicator plots volume at the bottom of the chart and the volume Moving Average (with the choice of Simple Moving Average (SMA) (default), Exponential Moving Average (EMA) and Volume Weighted Moving Average (VWMA)) and desired length (defaults to 20). It then changes the transparency of the volume (and the bars body) based on the close and the volume. It also changes the bar transparency. All these visual changes can be configured in the "Style" tab in the indicators settings.
The opacity will be high when the close is considered to be a "Strong close (%)" and has a bigger volume than any of the red closing in the last 10 bars. This "Strong close (%)" is defaulted to 50 which means that the bar needs to close equal or higher than 50% of the bar.
You also have an option to include red bars, which are excluded by default.
This indicator can help you to spot bars with relevant volume and find reversals.
I hope this explanation makes sense, let me know otherwise. Also let me know if you have any suggestions on improvements.
Best of trading luck!

FuTech V-Spike & V-HighlighterFuTech V-Spike & V-Highlighter
In the context of trading and technical analysis, this volume spike & volume highlighter indicator is the perfect indicator used to assess market activity and make informed trading decisions.
Let's Understand in brief as below :
1) Volume Spike :
A volume spike refers to a sudden, significant increase in trading volume compared to the average volume over a specific period.
This spike can indicate heightened interest in a particular security, often preceding price movements.
Traders may look for volume spikes as signals for potential buy or sell opportunities because they can suggest that a stock is experiencing increased activity, possibly due to news, earnings releases, or other catalysts.
Characteristics of a Volume Spike:
Assess the sudden increase in trading volume.
It Can occur in both upward and downward price movements.
Often compared to the average volume over a defined period (e.g., the last 20 days).
2) Volume Highlighter:
A volume highlighter emphasizes significant changes in trading volume on a price chart. This indicator typically uses color coding to highlight periods of high volume, making it easier for traders to identify volume spikes at a glance.
How this indicator works:
a) Volume Spike will calculate the highest volume spike as per the user defined threshold multiplier. (Multiplier = when volume exceeds a certain threshold)
b) The threshold Multiplier can be set based on a fixed number or as a multiple of the Exponential Moving Average volume. Volume Spike Multiplier default is 1.5, means the EMA volume should cross 1.5 times the user defined lookback period
c) The result is derived from the user defined lookback candles by using its EMA instead of SMA, which will give us more precise results.
d) By default, last 10 candles EMA average is used to calculate the Volume Spike but you can choose your lookback period as many days, weeks, months, years of your choice !
e) In Volume Spike -
- Green candle will show Yellow color Bar as Bullish sentiments, whereas
- Red candle will show Black Bar as Bearish sentiments.
f) Volume Highlighter will highlight the candles background if the highest volume is crossing as per the the user defined lookback period
g) Default Lookback period is 20, Color coding (e.g., Blue for bullish spikes, Red for bearish spikes) helps traders quickly assess the volume context.
h) Volume Highlighter plotting shapes and positions can be modified
Illustration:
From the Above pic,
If last Volume Spike is 10 lookback candles, Spike multiplier is 1.5 and Highlighter lookback candles is 20,
Then yellow candle means the spike in volume which is 1.5 times higher than the last 10 candles
Highlighting color defines the highest volumes trading from the last 20 candles which is either Blue (Bullish) or Red (Bearish) sentiments
Conclusion :
Using FuTech V-Spike & V-Highlighter indicator - will help traders identify potential trading opportunities and better understand market dynamics.
By analyzing volume in conjunction with price movements, traders can make more informed decisions based on market sentiment.
Thank you !
Jai Swaminarayan Dasna Das !
He Hari ! Bas Ek Tu Raji Tha !

Big Volume Highlighter ADVANCEDBIG VOLUME HIGHLIGHTER INDICATOR ADVANCED
The BIG VOLUME INDICATOR ADVANCED is an essential tool for traders who want to gain a deeper understanding of market dynamics through volume analysis. This advanced indicator highlights significant volume spikes, enabling traders to make more informed decisions based on market activity and price movements.
Key Features:
Customizable Lookback Period: Define the number of candles over which the highest volume is calculated, allowing you to adjust the analysis to fit your specific trading strategy and timeframe.
Approximate Volume Matching: Activate the approximate volume matching feature to identify candles that fall within a specified range of a target volume. This feature is particularly valuable for capturing notable volume spikes that may not match your exact input but are within an acceptable tolerance.
Flexible Volume Units: Input volumes in various units (Hundreds, Thousands, Millions, or Billions) to cater to your trading preferences. This flexibility ensures that you can analyze volume data in a way that aligns with your trading style.
Dynamic Tolerance Calculation: Set a percentage-based tolerance for volume matching, allowing for greater flexibility. For instance, if you input a volume of 600 million with a tolerance of 1.5%, the indicator will highlight candles with volumes ranging from 591 million to 609 million.
Visual Alerts: Highlighted candles are marked with clear, color-coded labels positioned above the bars. Green labels represent bullish candles, while red labels denote bearish candles, providing immediate visual feedback on market sentiment.
Mobile and Desktop Compatibility: Designed for seamless integration with TradingView, this indicator is accessible on both desktop and mobile devices, ensuring that you can monitor the market wherever you are.
How to Use:
Set the Lookback Period: Adjust the lookback period to analyze a specific number of candles for volume spikes.
Enable Approximate Volume Matching: If desired, toggle the approximate volume matching feature and enter your target volume, selecting the appropriate unit.
Adjust Tolerance: Define the tolerance percentage to specify how close the volume must be to your input for it to be considered significant.
Analyze the Chart: Observe the highlighted candles on your chart, which indicate significant volume activity based on your criteria.
Make Informed Decisions: Leverage the insights provided by the indicator to guide your trading decisions, identifying potential entry or exit points based on volume analysis.
****

Ehlers Loops [BigBeluga]The Ehlers Loops indicator is based on the concepts developed by John F. Ehlers, which provide a visual representation of the relationship between price and volume dynamics. This tool helps traders predict future market movements by observing how price and volume data interact within four distinct quadrants of the loop, each representing different combinations of price and volume directions. The unique structure of this indicator provides insights into the strength and direction of market trends, offering a clearer perspective on price behavior relative to volume.
🔵 KEY FEATURES & USAGE
● Four Price-Volume Quadrants:
The Ehlers Loops chart consists of four quadrants:
+Price & +Volume (top-right) – Typically indicates a bullish continuation in the market.
-Price & +Volume (bottom-right) – Generally shows a bearish continuation.
+Price & -Volume (top-left) – Typically indicates an exhaustion of demand with a potential reversal.
-Price & -Volume (bottom-left) – Indicates exhaustion of supply and near trend reversal.
By watching how symbols move through these quadrants over time, traders can assess shifts in momentum and volume flow.
● Price and Volume Scaling in Standard Deviations:
Both price and volume data are individually filtered using HighPass and SuperSmoother filters, which transform them into band-limited signals with zero mean. This scaling allows traders to view data in terms of its deviation from the average, making it easier to spot abnormal movements or trends in both price and volume.
● Loops Trajectories with Tails:
The loops draw a trail of price and volume dynamics over time, allowing traders to observe historical price-volume interactions and predict future movements based on the curvature and direction of the rotation.
● Price & Volume Histograms:
On the right side of the chart, histograms for each symbol provide a summary of the most recent price and volume values. These histograms allow traders to easily compare the strength and direction of multiple assets and evaluate market conditions at a glance.
● Flexible Symbol Display & Customization:
Traders can select up to five different symbols to be displayed within the Ehlers Loops. The settings also allow customization of symbol size, colors, and visibility of the histograms. Additionally, traders can adjust the LPPeriod and HPPeriod to change the smoothness and lag of the loops, with a shorter LPPeriod offering more responsiveness and a longer HPPeriod emphasizing longer-term trends.
🔵 USAGE
🔵 SETTINGS
Low pass Period: default is 10 to
obtain minimum lag with just a little smoothing.
High pass Period: default is 125 (half of the year if Daily timeframe) to capture the longer term moves.
🔵 CONCLUSION
The Ehlers Loops indicator offers a visually rich and highly customizable way to observe price and volume dynamics across multiple assets. By using band-limited signals and scaling data into standard deviations, traders gain a powerful tool for identifying market trends and predicting future movements. Whether you're tracking short-term fluctuations or long-term trends, Ehlers Loops can help you stay ahead of the market by offering key insights into the relationship between price and volume.

Price Action Volumetric Order Blocks [UAlgo]"Price Action Volumetric Order Blocks" indicator aims to identify significant price zones in the market based on a combination of price action and volume analysis. It utilizes the concept of "Order Blocks," which are areas on the chart where large orders are believed to have been placed, influencing price behavior. By analyzing price swings and volume activity, the indicator attempts to highlight potential support and resistance levels.
🔶 Key Features
Swing Length: This input allows you to adjust the timeframe used to identify price swings for order block detection. A longer swing length will focus on larger timeframes and potentially capture stronger order blocks.
Show Last X Order Blocks: This controls the number of order blocks displayed on the chart. You can choose to visualize a specific number of the most recent order blocks.
Violation Check: This setting determines how the indicator identifies potential order block violations. You can choose between "Wick" or "Close" violations. A "Wick" violation occurs when the price (wick) extends beyond the order block boundaries, while a "Close" violation signifies that the closing price breaches the order block.
Hide Overlap: This option allows you to manage the display of overlapping order blocks. If set to "True," only non-overlapping order blocks will be shown, potentially offering a clearer visualization.
Colors: You can customize the color scheme for bullish (upward) and bearish (downward) order blocks to enhance visual clarity on the chart.
🔶 Interpreting the Indicator
Order Blocks: The teal-colored boxes represent bullish order blocks, indicating areas of demand where buying pressure is likely to be strong. Red-colored boxes represent bearish order blocks, indicating areas of supply where selling pressure is likely to be dominant. These zones often signal potential reversal points or consolidation areas.
Strength Calculations: The indicator calculates the relative strength of bullish and bearish blocks based on volume. A higher bullish strength indicates stronger buying pressure, while higher bearish strength suggests more selling pressure. Traders can use this information to gauge the strength of a price level and predict future price movements.
Market Structure Lines: The indicator displays horizontal lines to depict the current market structure, labeled as "MSB" (Market Sell Balance) or "BOS" (Break of Structure). These lines can help visualize the prevailing trend direction.
Order Block Violations: When a price wick or close breaches an order block (depending on the chosen violation type), the corresponding order block visualization is removed from the chart. This can signify a potential weakening of the identified support or resistance zone.
🔶 Disclaimer
Use with Caution: This indicator is provided for educational and informational purposes only and should not be considered as financial advice. Users should exercise caution and perform their own analysis before making trading decisions based on the indicator's signals.
Not Financial Advice: The information provided by this indicator does not constitute financial advice, and the creator (UAlgo) shall not be held responsible for any trading losses incurred as a result of using this indicator.
Backtesting Recommended: Traders are encouraged to backtest the indicator thoroughly on historical data before using it in live trading to assess its performance and suitability for their trading strategies.
Risk Management: Trading involves inherent risks, and users should implement proper risk management strategies, including but not limited to stop-loss orders and position sizing, to mitigate potential losses.
No Guarantees: The accuracy and reliability of the indicator's signals cannot be guaranteed, as they are based on historical price data and past performance may not be indicative of future results.

Volume Profile Heatmap [UAlgo]The "Volume Profile Heatmap " indicator is a tool designed to visualize the distribution of trading volume across different price levels over a specified period. This heatmap-style indicator helps traders identify significant price levels where a high volume of trading activity has occurred, which can be crucial for making informed trading decisions. The indicator divides the price range into multiple levels and calculates the volume of trades occurring at each level, presenting this data in a visually intuitive manner using a gradient of colors.
By analyzing the volume profile, traders can gain insights into areas of support and resistance, as well as the Point of Control (POC)—the price level with the highest traded volume. This information is valuable in assessing market sentiment, potential reversal points, and key areas of interest where price action might consolidate or react.
🔶 Key Features
Customizable Analysis Period: The indicator allows users to specify the analysis period, defining the historical range over which the volume profile is calculated.
Adjustable Number of Levels: Users can set the number of price levels to divide the price range, offering flexibility in the granularity of the volume analysis.
Color-Coded Heatmap: The indicator uses a gradient color scheme to visually represent volume intensity at each price level. Higher volume areas are shaded differently than lower volume areas, making it easy to spot significant price levels.
Opacity Control: Users can adjust the opacity of the volume boxes, enabling a clearer or more subtle visualization according to their preferences.
Point of Control (POC) Display: The indicator highlights the Point of Control, the price level with the highest traded volume, with a distinct line on the chart, allowing traders to easily identify this critical level.
🔶 Disclaimer
Use with Caution: This indicator is provided for educational and informational purposes only and should not be considered as financial advice. Users should exercise caution and perform their own analysis before making trading decisions based on the indicator's signals.
Not Financial Advice: The information provided by this indicator does not constitute financial advice, and the creator (UAlgo) shall not be held responsible for any trading losses incurred as a result of using this indicator.
Backtesting Recommended: Traders are encouraged to backtest the indicator thoroughly on historical data before using it in live trading to assess its performance and suitability for their trading strategies.
Risk Management: Trading involves inherent risks, and users should implement proper risk management strategies, including but not limited to stop-loss orders and position sizing, to mitigate potential losses.
No Guarantees: The accuracy and reliability of the indicator's signals cannot be guaranteed, as they are based on historical price data and past performance may not be indicative of future results.

Volume Spread Analysis [AlgoAlpha]Unleash the power of Volume Spread Analysis (VSA) with our state-of-the-art indicator designed to detect market divergences and convergences, helping you make informed trading decisions. 📈
Key Features:
Detects bullish and bearish divergences based on volume and price movements. 📊🔍
Identifies bullish and bearish convergences, signaling potential trend continuations or reversals. 🔄📉
Customizable parameters for period length, volume SMA period, and outlier reduction factor. ⚙️🔧
Visual highlights for detected effects, with color-coded boxes and labels. 🟩🟥
Provides alerts for divergences and convergences, keeping you updated on market conditions. 🔔📬
📚 Introduction to Volume Spread Analysis (VSA) :
Volume Spread Analysis is a method used to interpret the relationship between volume and price to identify the intentions of market participants. By analyzing the spread (range) of a price bar and its corresponding volume, VSA helps traders discern market strength and potential reversals.
In VSA, harmony occurs when price and volume move in sync, such as when increasing prices(aka "Effect" in the script) are accompanied by increasing volume. This indicates a strong and healthy trend. Conversely, divergence happens when price and volume move in opposite directions. For example, if prices are rising lesser but volume is still high, it may signal a weakening trend and a potential reversal. Identifying these patterns helps traders understand market dynamics and make more informed trading decisions.
🛠 Quick Guide to Using the Volume Spread Analysis Indicator
⭐ Add the Indicator: Add the indicator to favorites by pressing the star icon. Customize settings such as period length, volume SMA period, and outlier reduction factor to fit your trading style.
📊 Market Analysis: Watch for color-coded boxes indicating effects and labels showing effort values. Look for divergences and convergences to identify potential trading opportunities. A higher work done suggests that the markets are needing to work harder to move the price and users can use that information as displayed below each trend impulse box to analyze the likely hood of trend continuation/reversals.
🔔 Alerts: Enable alerts for divergences and convergences to stay informed of critical market conditions without constant chart monitoring.
🔍 How It Works:
Our indicator meticulously analyzes volume and price data to detect significant market movements. It identifies periods where volume is above or below a moving average, marks these points, and tracks the price effect over a user-defined range. By calculating the effort (volume) and effect (price movement), it distinguishes between divergences and convergences based on predefined conditions. Bullish and bearish conditions are visually represented with color-coded boxes and labels, making it easy to spot trading opportunities. Alerts can be set to notify you of critical market conditions, ensuring you never miss a potential trade setup.
Happy trading! 📈🚀

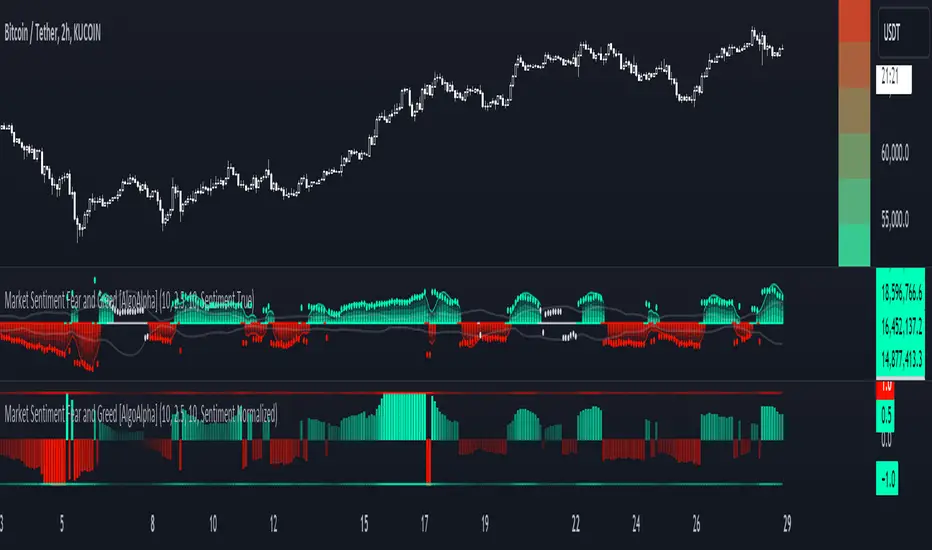
Market Sentiment Fear and Greed [AlgoAlpha]Unleash the power of sentiment analysis with the Market Sentiment Fear and Greed Indicator! 📈💡 This tool provides insights into market sentiment, helping you make informed trading decisions. Let's dive into its key features and how it works. 🚀✨
Key Features 🎯
🧠 Sentiment Analysis : Calculates market sentiment using volume and price data. 📊
📅 Customizable Lookback Window : Adjust the lookback period to fine-tune sensitivity. 🔧
🎨 Bullish and Bearish Colors : Visualize trends with customizable colors. 🟢🔴
🚀 Impulse Detection : Identifies bullish and bearish impulses for trend confirmation. 🔍
📉 Normalized Sentiment Index : Offers a normalized view of market sentiment. 📊
🔔 Alerts : Set alerts for key sentiment changes and trend impulses. 🚨
🟢🔴 Table Visualization : Displays sentiment strength using a gradient color table. 🗂️
How to Use 📖
Maximize your trading potential with this indicator by following these steps:
🔍 Add the Indicator : Search for "Market Sentiment Fear and Greed " in TradingView's Indicators & Strategies. Customize settings like the lookback window and trend breakout threshold to suit your trading strategy.
📊 Monitor Sentiment : Watch the sentiment gauge and plot changes to detect market sentiment shifts. Use the Normalized Sentiment Index for a more balanced view.
🚨 Set Alerts : Enable alerts for sentiment flips and trend impulses to stay ahead of market movements.
How It Works ⚙️
The indicator calculates market sentiment by averaging the volume and closing prices over a user-defined lookback period, creating a sentiment score. It differentiates between bullish and bearish sentiment by evaluating whether the closing price is higher or lower than the opening price, summing the respective volumes. The true sentiment is determined by comparing these summed values, with a positive score indicating bullish sentiment and a negative score indicating bearish sentiment. The indicator further normalizes this sentiment score by dividing it by the EMA of the highest high minus the lowest low over double the lookback period, ensuring values are constrained between -1 and 1. Bullish and bearish impulses are identified using Hull Moving Averages (HMA) of the positive and negative sentiments, respectively. When these impulses exceed a calculated threshold based on the standard deviation of the sentiment, it indicates a significant trend change. The script also includes a gradient color table to visually represent the strength of sentiment, and customizable alerts to notify users of key sentiment changes and trend impulses.
Unlock deeper insights into market sentiment and elevate your trading strategy with the Market Sentiment Fear and Greed Indicator! 📈✨
Volume Insignts AnalyzerDescription:
The Volume Insight Analyzer is an advanced Pine Script designed for traders who want a comprehensive view of volume dynamics on their charts. This script combines multiple volume-based indicators to help identify key trading opportunities, including significant volume days, volume dry-ups, and pocket pivots.
Key Features:
VDU (Volume Dry-Up) Detection: Automatically identifies and marks days when the volume is significantly below its moving average, helping to spot potential breakout or breakdown points. Customizable volume thresholds allow for tailored analysis based on your trading strategy. The Volume Dry-Up label appears when the volume is substantially below its average level and the price is near a key moving average. This condition indicates a period of equilibrium between supply and demand, suggesting a potential low-risk entry point for traders.
Pocket Pivot Analysis using 5 and 10 Length Pocket Pivots: Highlights days with exceptionally high volume compared to recent history, indicating potential pocket pivots. Visual markers on the chart and volume bars color-coded for 5 and 10-day lengths. Pocket pivot points are identified when the volume on a given day exceeds the maximum volume observed over the past several days. Specifically, a 5-day pocket pivot point is marked when today's volume surpasses the highest selling volume of the last 5 days. A cluster of 5-day pocket pivot points within a base is a strong indicator of stock strength. Similarly, a 10-day pocket pivot point following a Volume Dry-Up (VDU) suggests a potential entry opportunity. Moreover, a pre-existing cluster of 5-day pocket pivot points before a 10-day pocket pivot point provides greater conviction in the trade.
Volume Moving Averages: Set different lengths for primary and secondary moving averages to track volume trends over daily, weekly, and monthly timeframes. Options to display moving average lines on the volume chart.
Volume Visualization:
a. Major and Minor Volume Bars: Option to display bars that are either above or below average volume levels. Adjustable settings to show or hide these bars based on user preference.
b. Volume Bar Coloring: Volume bars are color-coded based on significant volume thresholds, including green for bullish signals, red for bearish signals, and orange for volume dry-ups.
Volume Metrics Table: A customizable table that displays real-time volume metrics including Relative Volume (RVOL), Turnover, and the number of high volume days. The table can be oriented horizontally or vertically and styled according to your theme preferences.
Visual Indicators:
a) Volume Dry-Up (VDU) Labels: Clearly marked VDU events with textual annotations on the chart.
b) Bullish and Bearish Arrows: Arrows indicating potential bullish or bearish closes based on volume analysis, enhancing decision-making.
Customization Options:
a) Dark and Light Theme Support: Toggle between dark and light themes to match your chart settings.
b) Adjustable Parameters: Easily configure input settings such as volume thresholds, MA lengths, and table display options to fit your trading style.
How to Use:
Set Parameters: Adjust the script settings such as volume thresholds, moving average lengths, and display preferences according to your analysis needs.
Analyze Volume Patterns: Use the indicators and visual markers provided by the script to identify significant volume patterns and potential trading signals.
Monitor Metrics: Refer to the volume metrics table for a quick overview of key volume-related statistics and trends.
Make Informed Decisions: Utilize the visual cues and volume data provided by the script to enhance your trading strategy and make more informed decisions.
Disclaimer:
This script is for informational purposes only and should not be considered as trading advice. Use it in conjunction with other analysis tools and consult with a financial advisor if needed. Trading involves risk, and past performance does not guarantee future results.
