vdubus

Vdub FX SniperVX2 Color v2

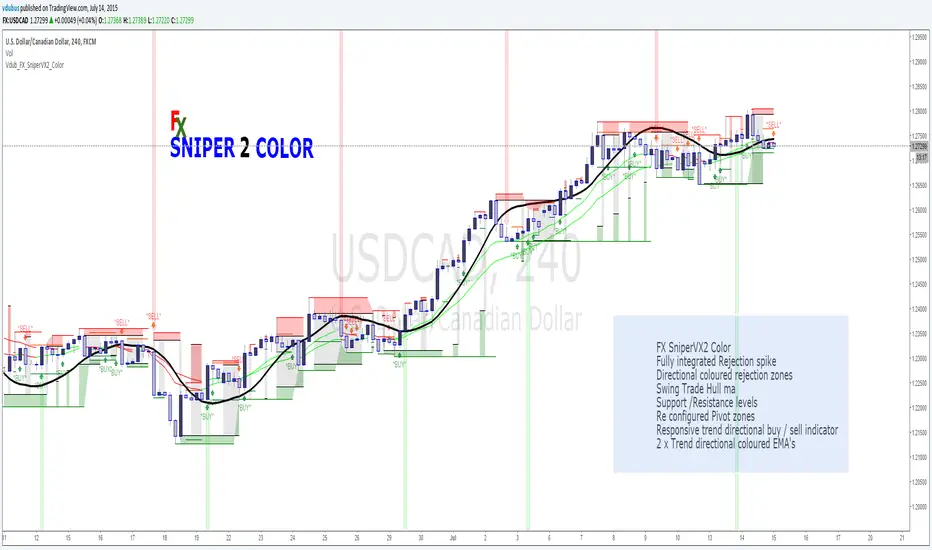
FX SniperVX2 Color
Fully integrated Rejection spike
Directional coloured rejection zones
Swing Trade Hull ma
Support /Resistance levels
Re configured Pivot zones
Responsive trend directional buy / sell indicator
2 x Trend directional coloured EMA's

Sniper series

Skrip sumber terbuka

Dalam semangat TradingView yang sebenar, penulis skrip ini telah menerbitkannya dengan menggunakan sumber terbuka supaya pedagang-pedagang dapat memahami dan mengesahkannya. Sorakan kepada penulis! Anda dapat menggunakannya secara percuma tetapi penggunaan semula kod ini dalam penerbitan adalah dikawalselia oleh Peraturan Dalaman. Anda boleh menyukainya untuk menggunakannya pada carta.

Penafian

Maklumat dan penerbitan adalah tidak dimaksudkan untuk menjadi, dan tidak membentuk, nasihat untuk kewangan, pelaburan, perdagangan dan jenis-jenis lain atau cadangan yang dibekalkan atau disahkan oleh TradingView. Baca dengan lebih lanjut di Terma Penggunaan.

Ingin menggunakan skrip ini pada carta?
//╭╮╱╱╭╮╭╮╱╱╭╮
//┃╰╮╭╯┃┃┃╱╱┃┃
//╰╮┃┃╭┻╯┣╮╭┫╰━┳╮╭┳━━╮
//╱┃╰╯┃╭╮┃┃┃┃╭╮┃┃┃┃━━┫
//╱╰╮╭┫╰╯┃╰╯┃╰╯┃╰╯┣━━┃
//╱╱╰╯╰━━┻━━┻━━┻━━┻━━╯
//╭━━━┳╮╱╱╱╱╱╱╱╭╮
//┃╭━╮┃┃╱╱╱╱╱╱╱┃┃
//┃┃╱╰┫╰━┳━━┳━╮╭━╮╭━━┫┃
//┃┃╱╭┫╭╮┃╭╮┃╭╮┫╭╮┫┃━┫┃
//┃╰━╯┃┃┃┃╭╮┃┃┃┃┃┃┃┃━┫╰╮
//╰━━━┻╯╰┻╯╰┻╯╰┻╯╰┻━━┻━╯
//━╯
//Vdub FX SniperVX2 Color v2 / Vdub Rejection Spike v3 Full intergration -
//  ©Vdubus http://www.vdubus.co.uk/
study("Vdub FX SniperVX2 Color v2", overlay=true, shorttitle="Vdub_FX_SniperVX2_Color")
//===================Candle body resistance Channel====================//
len = 34
src = input(close, title="Candle body resistance Channel")
out = sma(src, len)
last8h = highest(close, 13)
lastl8 = lowest(close, 13)
bearish = cross(close,out) == 1 and falling(close, 1)
bullish = cross(close,out) == 1 and rising(close, 1)
channel2=input(false, title="Bar Channel On/Off")
ul2=plot(channel2?last8h:last8h==nz(last8h[1])?last8h:na, color=black, linewidth=1, style=linebr, title="Candle body resistance level top", offset=0)
ll2=plot(channel2?lastl8:lastl8==nz(lastl8[1])?lastl8:na, color=black, linewidth=1, style=linebr, title="Candle body resistance level bottom", offset=0)
fill(ul2, ll2, color=black, transp=90, title="Candle body resistance Channel")
//=============================================================//
//-------------LB---------------------------
channel=input(false, title="Resistance Channel 2 On/Off")
up = close<nz(up[1]) and close>down[1] ? nz(up[1]) : high
down = close<nz(up[1]) and close>down[1] ? nz(down[1]) : low
ul=plot(channel?up:up==nz(up[1])?up:na, color=red, linewidth=1, style=linebr, title="Resistance Level top", offset=0)
ll=plot(channel?down:down==nz(down[1])?down:na, color=green, linewidth=1, style=linebr, title="Resistance level bottom", offset=0)

// Moddified [RS]Support and Resistance V0
RST = input(title='Support / Resistance length:', type=integer, defval=6)     // color zone length
RSTT = valuewhen(high >= highest(high, RST), high, 0)
RSTB = valuewhen(low <= lowest(low, RST), low, 0)
RT2 = plot(RSTT, color=RSTT != RSTT[1] ? na : red, linewidth=1, offset=+0)
RB2 = plot(RSTB, color=RSTB != RSTB[1] ? na : green, linewidth=1, offset=0)
//
//--------------------Trend colour ema------------------------------------------------// 
src0 = close, len0 = input(13, minval=1, title="EMA 1")
ema0 = ema(src0, len0)
direction = rising(ema0, 2) ? +1 : falling(ema0, 2) ? -1 : 0
plot_color = direction > 0  ? lime: direction < 0 ? red : na
plot(ema0, title="EMA", style=line, linewidth=1, color = plot_color)
//--------------------Trend colour ema 2------------------------------------------------//
src02 = close, len02 = input(21, minval=1, title="EMA 2")
ema02 = ema(src02, len02)
direction2 = rising(ema02, 2) ? +1 : falling(ema02, 2) ? -1 : 0
plot_color2 = direction2 > 0  ? lime: direction2 < 0 ? red : na
plot(ema02, title="EMA Signal 2", style=line, linewidth=1, color = plot_color2)
//
//--Modified vyacheslav.shindin-------------------------------------------------//           Signal 1
//Configured ema signal output
fast = input(5, minval=1, title="Short Signal Generator")
slow = input(8, minval=1)
vh1 = ema(highest(avg(low, close), fast), 5)
vl1 = ema(lowest(avg(high, close), slow), 8)
//
e_ema1 = ema(close, 1)
e_ema2 = ema(e_ema1, 1)
e_ema3 = ema(e_ema2, 1)
tema = 1 * (e_ema1 - e_ema2) + e_ema3
//
e_e1 = ema(close, 8)
e_e2 = ema(e_e1, 5)
dema = 2 * e_e1 - e_e2
signal = tema > dema ? max(vh1, vl1) : min(vh1, vl1)
is_call = tema > dema and signal > low and (signal-signal[1] > signal[1]-signal[2])
is_put = tema < dema and signal < high and (signal[1]-signal > signal[2]-signal[1])
plotshape(is_call and direction > 0 ? 1 : na, title="BUY ARROW", color=green, text="*BUY*", style=shape.arrowup, location=location.belowbar)
plotshape(is_put and direction < 0 ? -1 : na, title="SELL ARROW", color=red, text="*SELL*", style=shape.arrowdown)
//
//Modified - Rajandran R Supertrend----------------------------------------------------- //       Signal 2
Factor=input(3, minval=1,maxval = 1000, title="Trend Transition Signal")
Pd=input(1, minval=1,maxval = 1000, title="Period")
Up=hl2-(Factor*atr(Pd))
Dn=hl2+(Factor*atr(Pd))
TrendUp=close[1]>TrendUp[1]? max(Up,TrendUp[1]) : Up
TrendDown=close[1]<TrendDown[1]? min(Dn,TrendDown[1]) : Dn
Trend = close > TrendDown[1] ? 1: close< TrendUp[1]? -1: nz(Trend[1],0)
plotarrow(Trend == 1 and Trend[1] == -1 ? Trend : na, title="Up Entry Arrow", colorup=lime, maxheight=1000, minheight=50, transp=85)
plotarrow(Trend == -1 and Trend[1] == 1 ? Trend : na, title="Down Entry Arrow", colordown=red, maxheight=1000, minheight=50, transp=85)
//
//=============Hull MA//
show_hma = input(true, title="Display Hull MA Set:")
hma_src = input(close, title="Hull MA's Source:")
hma_base_length = input(8, minval=1, title="Hull MA's Base Length:")
hma_length_scalar = input(5, minval=0, title="Hull MA's Length Scalar:")
hullma(src, length)=>wma(2*wma(src, length/2)-wma(src, length), round(sqrt(length)))
plot(not show_hma ? na : hullma(hma_src, hma_base_length+hma_length_scalar*6), color=black, linewidth=3, title="Hull MA")
//===============================================
//
fill(ul2, RT2, color=red, transp=75, title="Fill")
fill(ll2, RB2, color=green, transp=75, title="Fill")
////////////////////////////////////////////////////////////////////////////////////////////
////////////////////////////////////////////////////////////////////////////////////////////