OPEN-SOURCE SCRIPT
Candlestick Pattern Scanner
Candlestick Pattern Scanner
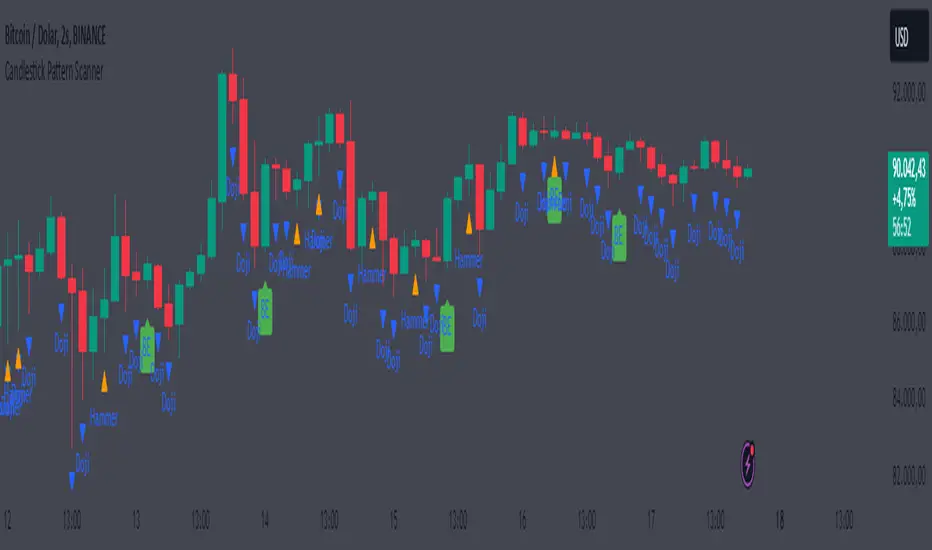
This indicator identifies popular candlestick patterns on the chart and provides visual and alert-based support for traders. Based on technical analysis, it provides insights into potential trend reversals or continuation signals in price action. The following patterns are detected and marked:
1. Bullish Engulfing
Definition: Considered a strong bullish signal. A small red candle is followed by a large green candle that completely engulfs the previous one.
Chart Display: Marked with a green arrow below the price bar.
Alert Message: "Bullish Engulfing Pattern Detected!"
2. Bearish Engulfing
Definition: Considered a strong bearish signal. A small green candle is followed by a large red candle that completely engulfs the previous one.
Chart Display: Marked with a red arrow above the price bar.
Alert Message: "Bearish Engulfing Pattern Detected!"
3. Doji
Definition: Indicates indecision in the market. The candlestick has an opening and closing price that are almost the same, forming a very small body.
Chart Display: Marked with a blue triangle below the price bar.
Alert Message: "Doji Pattern Detected!"
4. Hammer
Definition: Can signal a strong bullish reversal. It has a long lower shadow and a small body, often appearing at the end of a downtrend.
Chart Display: Marked with an orange triangle below the price bar.
Alert Message: "Hammer Pattern Detected!"
5. Shooting Star
Definition: Can signal a strong bearish reversal. It has a long upper shadow and a small body, often appearing at the end of an uptrend.
Chart Display: Marked with a purple triangle above the price bar.
Alert Message: "Shooting Star Pattern Detected!"
Features:
Visual Support: Patterns are clearly marked on the chart using distinct shapes (arrows and triangles).
Alerts: Receive real-time notifications through TradingView’s alert system when a pattern is detected.
Versatility: Useful for identifying both trend reversals and continuation signals.
User-Friendly: Patterns are easily distinguishable with unique color coding.
Purpose:
This indicator helps traders identify potential reversal points or strong trend beginnings in price action. It can be used as a supportive tool in scalping, swing trading, or long-term investment strategies.
Skrip sumber terbuka
Dalam semangat TradingView sebenar, pencipta skrip ini telah menjadikannya sumber terbuka, jadi pedagang boleh menilai dan mengesahkan kefungsiannya. Terima kasih kepada penulis! Walaupuan anda boleh menggunakan secara percuma, ingat bahawa penerbitan semula kod ini tertakluk kepada Peraturan Dalaman.
Penafian
Maklumat dan penerbitan adalah tidak bertujuan, dan tidak membentuk, nasihat atau cadangan kewangan, pelaburan, dagangan atau jenis lain yang diberikan atau disahkan oleh TradingView. Baca lebih dalam Terma Penggunaan.