PROTECTED SOURCE SCRIPT
Leonidas Volatility Oscillator
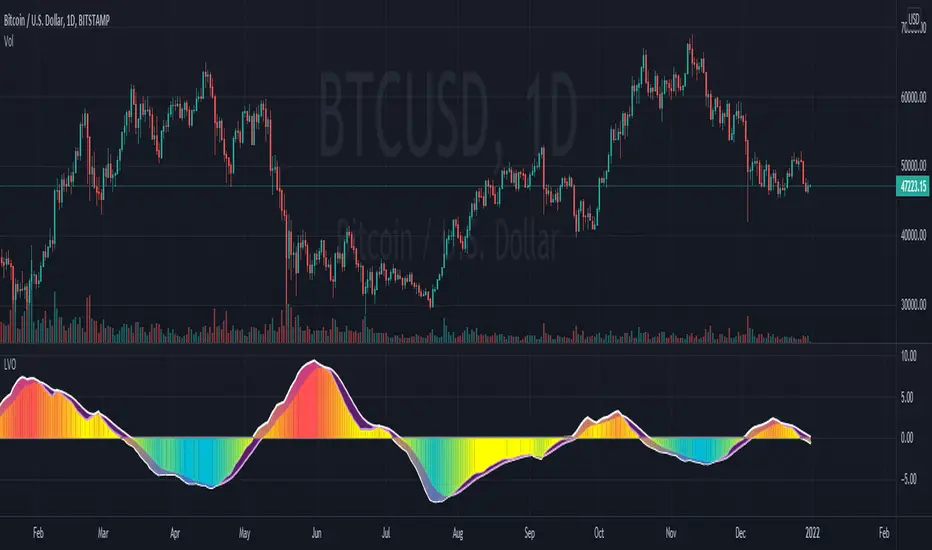
This indicator is showing the volatility based on ATR or Historical Volatility.
Volatility is one of the most powerful tools to catch explosive moves or identify when the market is in consolidation/distribution phase.
How to use this indicator:
Colors:
Blue Color is they most important color for this indicator .
This color is suggesting the volatility is reaching the lowest point the market is in consolidation/distribution phase. Depending of the time frame after this phase you will see an expansion.

Yellow/Red Color
Usually we will see this when the market is trending.

Trend.
This indicator is interesting because you will know if the volatility is trending powerful to keep your positions or ride the trend .

This indicator will not tell you when to sell or buy.
This indicator will help you to identify explosive moves, consolidation/distribution phases.
Volatility is one of the most powerful tools to catch explosive moves or identify when the market is in consolidation/distribution phase.
How to use this indicator:
Colors:
Blue Color is they most important color for this indicator .
This color is suggesting the volatility is reaching the lowest point the market is in consolidation/distribution phase. Depending of the time frame after this phase you will see an expansion.
Yellow/Red Color
Usually we will see this when the market is trending.
Trend.
This indicator is interesting because you will know if the volatility is trending powerful to keep your positions or ride the trend .
This indicator will not tell you when to sell or buy.
This indicator will help you to identify explosive moves, consolidation/distribution phases.
Skrip dilindungi
Skrip ini diterbitkan sebagai sumber tertutup. Akan tetapi, anda boleh menggunakannya secara bebas dan tanpa apa-apa had – ketahui lebih di sini.
Trading for living!
Penafian
Maklumat dan penerbitan adalah tidak bertujuan, dan tidak membentuk, nasihat atau cadangan kewangan, pelaburan, dagangan atau jenis lain yang diberikan atau disahkan oleh TradingView. Baca lebih dalam Terma Penggunaan.