OPEN-SOURCE SCRIPT
Previous Candle Range Split into Thirds
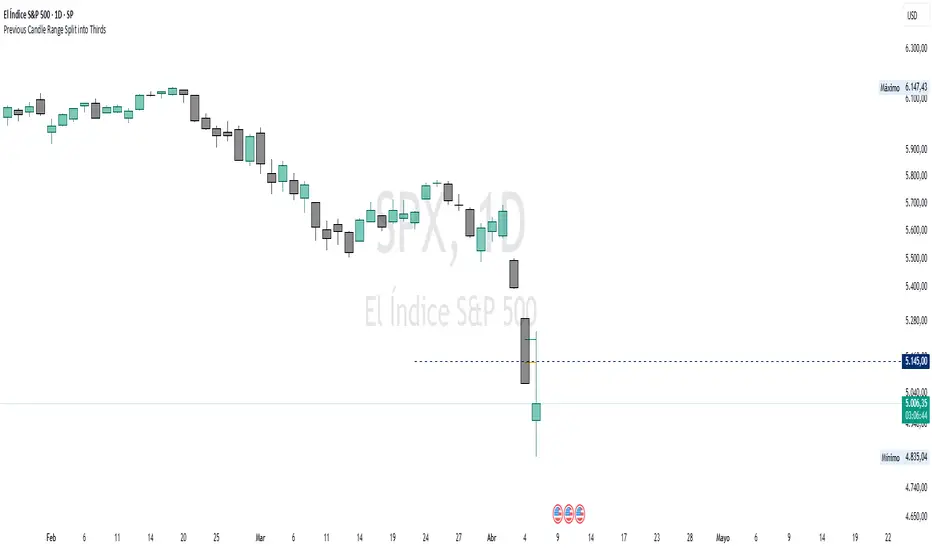
This script plots two horizontal lines over the previous candle to divide its total range (high to low) into three equal parts. The first line marks 33% of the range from the low, and the second marks 66%. This helps users visually identify whether the previous candle closed in the lower, middle, or upper third of its range, providing context on potential buyer or seller dominance during that session.
Users can customize the color, width, and style (solid, dotted, dashed) of each line, as well as toggle their visibility from the script's input settings.
This indicator is designed as a discretionary analysis tool and does not generate buy or sell signals.
Users can customize the color, width, and style (solid, dotted, dashed) of each line, as well as toggle their visibility from the script's input settings.
This indicator is designed as a discretionary analysis tool and does not generate buy or sell signals.
Skrip sumber terbuka
Dalam semangat TradingView sebenar, pencipta skrip ini telah menjadikannya sumber terbuka, jadi pedagang boleh menilai dan mengesahkan kefungsiannya. Terima kasih kepada penulis! Walaupuan anda boleh menggunakan secara percuma, ingat bahawa penerbitan semula kod ini tertakluk kepada Peraturan Dalaman.
Setup + Risk Management + 1% better daily = Consistency. 📈
Penafian
Maklumat dan penerbitan adalah tidak bertujuan, dan tidak membentuk, nasihat atau cadangan kewangan, pelaburan, dagangan atau jenis lain yang diberikan atau disahkan oleh TradingView. Baca lebih dalam Terma Penggunaan.