PROTECTED SOURCE SCRIPT
Malama's Dashboard with Heikin
Malama's Dashboard with Heikin is a comprehensive trading indicator designed to provide traders with a consolidated view of market sentiment across multiple technical indicators. It combines Ichimoku Cloud, RSI, ADX, Choppiness Index, volume analysis, momentum, divergence detection, and multi-timeframe (MTF) MACD and volume trends to generate a composite sentiment score. The indicator displays these metrics in a visually intuitive table, enabling traders to quickly assess market conditions and make informed decisions. Optionally, it supports Heikin Ashi candles to smooth price data and reduce noise, aiding in trend identification. The script solves the problem of information overload by presenting key indicators in a single, trader-friendly dashboard, reducing the need for multiple charts or indicators.
Originality and Usefulness
This script is a unique mashup of several well-known technical indicators, integrated into a cohesive dashboard with a composite sentiment score. Unlike standalone indicators like RSI or Ichimoku, this script synthesizes signals from Ichimoku Cloud, RSI, ADX, Choppiness, volume, momentum, divergence, and MTF analysis into a unified sentiment metric. The inclusion of Heikin Ashi candles as an optional input adds flexibility for traders preferring smoothed price action. The composite score, derived from weighted contributions of each indicator, provides a novel way to gauge overall market direction, which is not commonly found in public open-source scripts. While individual components like RSI or Ichimoku are widely available, the script’s originality lies in its integrated approach, clear table visualization, and customizable settings, making it a practical tool for traders seeking a holistic market view.
Detailed Methodology ("How It Works")
The script processes multiple technical indicators and aggregates their signals into a composite sentiment score, displayed in a table. Below is a breakdown of its core components and logic:
Heikin Ashi Candles:
Logic: Optionally applies Heikin Ashi calculations to smooth price data. Heikin Ashi candles are computed using formulas for open, high, low, and close prices, reducing market noise and emphasizing trends.
Usage: When enabled, all subsequent calculations (Ichimoku, RSI, ADX, etc.) use Heikin Ashi prices instead of regular OHLC data, potentially improving trend clarity.
Ichimoku Cloud:
Logic: Calculates the Conversion Line (9-period high/low average), Base Line (26-period high/low average), Leading Span A (average of Conversion and Base Lines), and Leading Span B (52-period high/low average).
Signals: Bullish if the close price is above both Leading Spans; bearish if below; neutral otherwise.
Average Directional Index (ADX):
Logic: Computes ADX using a 14-period (default) directional movement index, measuring trend strength. PlusDI and MinusDI are calculated from price movements, and ADX is derived from their difference.
Signals: Bullish if PlusDI > MinusDI; bearish otherwise. ADX value indicates trend strength but is not used directly in sentiment scoring.
Relative Strength Index (RSI):
Logic: Calculates RSI over a 21-period (default) using the closing price. Overbought (>75) and oversold (<25) levels are user-defined.
Signals: Bullish if RSI > 50; bearish if RSI < 50. Overbought/oversold conditions are displayed but not used in the composite score.
Momentum:
Logic: Measures the difference between the current close and the close 10 periods ago (default).
Signals: Bullish if momentum > 0; bearish if < 0; neutral if 0.
Choppiness Index:
Logic: Calculates choppiness over a 14-period (default) using ATR and price range, normalized to a 0–100 scale. Values >61.8 indicate a sideways market; <38.2 indicate a trending market.
Signals: Bullish if choppiness < 38.2; bearish otherwise.
Volume Analysis:
Logic: Compares current volume to a 21-period (default) simple moving average (SMA). Bullish or bearish pressure is determined by whether the close is above or below the open.
Signals: Bullish if volume > 1.2x SMA and bullish pressure dominates; bearish if bearish pressure dominates; neutral otherwise.
Divergence Detection:
Logic: Identifies RSI divergences over a 5-period lookback. A bullish divergence occurs when price makes a lower low, but RSI makes a higher low; bearish divergence is the opposite.
Signals: Bullish or bearish based on divergence detection; neutral if no divergence.
Multi-Timeframe (MTF) Analysis:
Logic: Retrieves daily MACD (12, 26, 9) and volume SMA (21-period) from a higher timeframe. MACD is bullish if the MACD line > signal line; volume is bullish if current volume > daily SMA.
Signals: Bullish or bearish based on MACD and volume trends.
Composite Sentiment Score:
Logic: Aggregates signals from Ichimoku (±2), RSI (±1), ADX (±1), momentum (±1), choppiness (±1), divergence (±1), MTF MACD (±1), and MTF volume (±1). The score ranges from -8 to +8.
Signals: Bullish if score > 0; bearish if < 0; neutral if 0.
Alert Condition:
Triggers an alert when the composite sentiment flips (e.g., from bullish to bearish).
Strategy Results and Risk Management
This script is an indicator, not a strategy, and does not include backtesting or automated trade signals. However, the composite sentiment score can guide trading decisions. Assumptions for practical use include:
Commission and Slippage: Traders should account for realistic trading costs (e.g., 0.1% per trade) when acting on signals, though the script does not model these.
Risk Limits: Traders are advised to risk 5–10% of equity per trade, depending on their strategy and the strength of the composite score (e.g., higher scores may justify larger positions).
Trade Frequency: The script’s signals are based on multiple indicators, ensuring sufficient trade opportunities across trending and ranging markets.
Customization: Traders can adjust risk by modifying input parameters (e.g., RSI overbought/oversold levels or lookback periods) to align with their risk tolerance. For example, tightening RSI thresholds may reduce signal frequency but increase precision.
User Settings and Customization
The script offers several user-configurable inputs, allowing traders to tailor its behavior:
Use Heikin Ashi Candles (Boolean, default: false): Enables/disables Heikin Ashi smoothing for all calculations, affecting trend clarity.
ADX Length (Integer, default: 14, min: 1): Sets the period for ADX calculations, influencing trend strength sensitivity.
RSI Length (Integer, default: 21, min: 1): Adjusts RSI calculation period, impacting overbought/oversold detection.
RSI Overbought Level (Integer, default: 75, min: 1): Sets the RSI overbought threshold.
RSI Oversold Level (Integer, default: 25, min: 1): Sets the RSI oversold threshold.
Volatility Length (Integer, default: 21, min: 1): Controls the ATR period for volatility (used in Choppiness).
Volume MA Length (Integer, default: 21, min: 1): Sets the SMA period for volume analysis.
Momentum Length (Integer, default: 10, min: 1): Defines the lookback for momentum calculations.
Choppiness Length (Integer, default: 14, min: 1): Sets the period for Choppiness Index calculations.
These settings allow traders to adjust the indicator’s sensitivity to market conditions. For example, shorter RSI or ADX periods increase responsiveness but may generate more noise, while longer periods smooth signals but may lag.
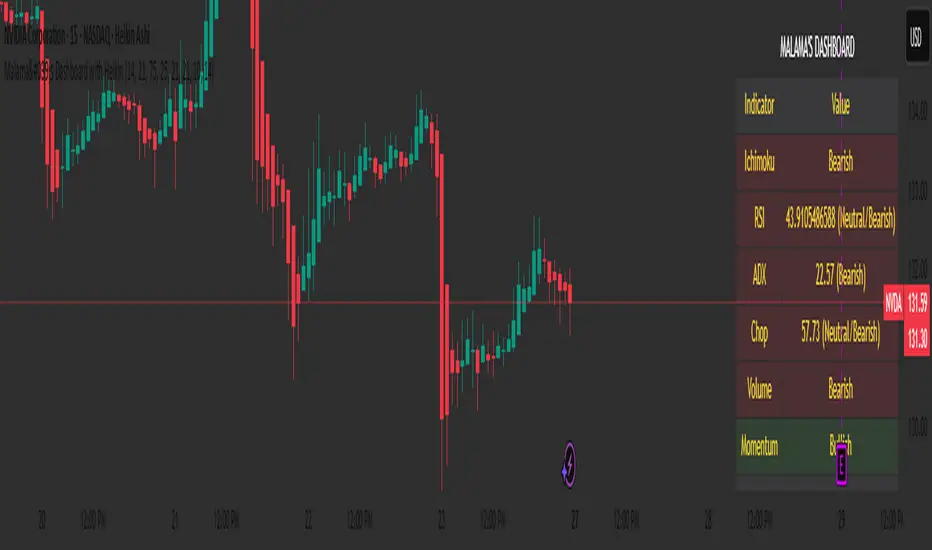
Visualizations and Chart Setup
The script plots a table in the top-right corner of the chart, summarizing the following:
Header: Displays “MALAMA’S DASHBOARD” in white text on a black background.
Indicator Rows: Each row corresponds to an indicator (Ichimoku, RSI, ADX, Choppiness, Volume, Momentum, Divergence, MTF MACD, MTF Volume, Composite).
Columns:
Indicator: Lists the indicator name.
Value: Shows the calculated value (e.g., RSI value, composite score) and sentiment (e.g., Bullish, Bearish, Neutral).
Color Coding: Bullish signals are green, bearish signals are red, and neutral signals are gray, all with 85% transparency for readability.
Composite Sentiment: The final row displays the composite score and sentiment, providing a quick summary of market direction.
No trend lines, signal markers, or additional overlays are plotted, ensuring the chart remains uncluttered and focused on the dashboard’s insights.
Originality and Usefulness
This script is a unique mashup of several well-known technical indicators, integrated into a cohesive dashboard with a composite sentiment score. Unlike standalone indicators like RSI or Ichimoku, this script synthesizes signals from Ichimoku Cloud, RSI, ADX, Choppiness, volume, momentum, divergence, and MTF analysis into a unified sentiment metric. The inclusion of Heikin Ashi candles as an optional input adds flexibility for traders preferring smoothed price action. The composite score, derived from weighted contributions of each indicator, provides a novel way to gauge overall market direction, which is not commonly found in public open-source scripts. While individual components like RSI or Ichimoku are widely available, the script’s originality lies in its integrated approach, clear table visualization, and customizable settings, making it a practical tool for traders seeking a holistic market view.
Detailed Methodology ("How It Works")
The script processes multiple technical indicators and aggregates their signals into a composite sentiment score, displayed in a table. Below is a breakdown of its core components and logic:
Heikin Ashi Candles:
Logic: Optionally applies Heikin Ashi calculations to smooth price data. Heikin Ashi candles are computed using formulas for open, high, low, and close prices, reducing market noise and emphasizing trends.
Usage: When enabled, all subsequent calculations (Ichimoku, RSI, ADX, etc.) use Heikin Ashi prices instead of regular OHLC data, potentially improving trend clarity.
Ichimoku Cloud:
Logic: Calculates the Conversion Line (9-period high/low average), Base Line (26-period high/low average), Leading Span A (average of Conversion and Base Lines), and Leading Span B (52-period high/low average).
Signals: Bullish if the close price is above both Leading Spans; bearish if below; neutral otherwise.
Average Directional Index (ADX):
Logic: Computes ADX using a 14-period (default) directional movement index, measuring trend strength. PlusDI and MinusDI are calculated from price movements, and ADX is derived from their difference.
Signals: Bullish if PlusDI > MinusDI; bearish otherwise. ADX value indicates trend strength but is not used directly in sentiment scoring.
Relative Strength Index (RSI):
Logic: Calculates RSI over a 21-period (default) using the closing price. Overbought (>75) and oversold (<25) levels are user-defined.
Signals: Bullish if RSI > 50; bearish if RSI < 50. Overbought/oversold conditions are displayed but not used in the composite score.
Momentum:
Logic: Measures the difference between the current close and the close 10 periods ago (default).
Signals: Bullish if momentum > 0; bearish if < 0; neutral if 0.
Choppiness Index:
Logic: Calculates choppiness over a 14-period (default) using ATR and price range, normalized to a 0–100 scale. Values >61.8 indicate a sideways market; <38.2 indicate a trending market.
Signals: Bullish if choppiness < 38.2; bearish otherwise.
Volume Analysis:
Logic: Compares current volume to a 21-period (default) simple moving average (SMA). Bullish or bearish pressure is determined by whether the close is above or below the open.
Signals: Bullish if volume > 1.2x SMA and bullish pressure dominates; bearish if bearish pressure dominates; neutral otherwise.
Divergence Detection:
Logic: Identifies RSI divergences over a 5-period lookback. A bullish divergence occurs when price makes a lower low, but RSI makes a higher low; bearish divergence is the opposite.
Signals: Bullish or bearish based on divergence detection; neutral if no divergence.
Multi-Timeframe (MTF) Analysis:
Logic: Retrieves daily MACD (12, 26, 9) and volume SMA (21-period) from a higher timeframe. MACD is bullish if the MACD line > signal line; volume is bullish if current volume > daily SMA.
Signals: Bullish or bearish based on MACD and volume trends.
Composite Sentiment Score:
Logic: Aggregates signals from Ichimoku (±2), RSI (±1), ADX (±1), momentum (±1), choppiness (±1), divergence (±1), MTF MACD (±1), and MTF volume (±1). The score ranges from -8 to +8.
Signals: Bullish if score > 0; bearish if < 0; neutral if 0.
Alert Condition:
Triggers an alert when the composite sentiment flips (e.g., from bullish to bearish).
Strategy Results and Risk Management
This script is an indicator, not a strategy, and does not include backtesting or automated trade signals. However, the composite sentiment score can guide trading decisions. Assumptions for practical use include:
Commission and Slippage: Traders should account for realistic trading costs (e.g., 0.1% per trade) when acting on signals, though the script does not model these.
Risk Limits: Traders are advised to risk 5–10% of equity per trade, depending on their strategy and the strength of the composite score (e.g., higher scores may justify larger positions).
Trade Frequency: The script’s signals are based on multiple indicators, ensuring sufficient trade opportunities across trending and ranging markets.
Customization: Traders can adjust risk by modifying input parameters (e.g., RSI overbought/oversold levels or lookback periods) to align with their risk tolerance. For example, tightening RSI thresholds may reduce signal frequency but increase precision.
User Settings and Customization
The script offers several user-configurable inputs, allowing traders to tailor its behavior:
Use Heikin Ashi Candles (Boolean, default: false): Enables/disables Heikin Ashi smoothing for all calculations, affecting trend clarity.
ADX Length (Integer, default: 14, min: 1): Sets the period for ADX calculations, influencing trend strength sensitivity.
RSI Length (Integer, default: 21, min: 1): Adjusts RSI calculation period, impacting overbought/oversold detection.
RSI Overbought Level (Integer, default: 75, min: 1): Sets the RSI overbought threshold.
RSI Oversold Level (Integer, default: 25, min: 1): Sets the RSI oversold threshold.
Volatility Length (Integer, default: 21, min: 1): Controls the ATR period for volatility (used in Choppiness).
Volume MA Length (Integer, default: 21, min: 1): Sets the SMA period for volume analysis.
Momentum Length (Integer, default: 10, min: 1): Defines the lookback for momentum calculations.
Choppiness Length (Integer, default: 14, min: 1): Sets the period for Choppiness Index calculations.
These settings allow traders to adjust the indicator’s sensitivity to market conditions. For example, shorter RSI or ADX periods increase responsiveness but may generate more noise, while longer periods smooth signals but may lag.
Visualizations and Chart Setup
The script plots a table in the top-right corner of the chart, summarizing the following:
Header: Displays “MALAMA’S DASHBOARD” in white text on a black background.
Indicator Rows: Each row corresponds to an indicator (Ichimoku, RSI, ADX, Choppiness, Volume, Momentum, Divergence, MTF MACD, MTF Volume, Composite).
Columns:
Indicator: Lists the indicator name.
Value: Shows the calculated value (e.g., RSI value, composite score) and sentiment (e.g., Bullish, Bearish, Neutral).
Color Coding: Bullish signals are green, bearish signals are red, and neutral signals are gray, all with 85% transparency for readability.
Composite Sentiment: The final row displays the composite score and sentiment, providing a quick summary of market direction.
No trend lines, signal markers, or additional overlays are plotted, ensuring the chart remains uncluttered and focused on the dashboard’s insights.
Skrip dilindungi
Skrip ini diterbitkan sebagai sumber tertutup. Akan tetapi, anda boleh menggunakannya secara bebas dan tanpa apa-apa had – ketahui lebih di sini.
Penafian
Maklumat dan penerbitan adalah tidak bertujuan, dan tidak membentuk, nasihat atau cadangan kewangan, pelaburan, dagangan atau jenis lain yang diberikan atau disahkan oleh TradingView. Baca lebih dalam Terma Penggunaan.