AlphaZ-Score - Bitcoin Market Cycle Indicator
AlphaZ-Score is a Bitcoin-specific market cycle indicator that identifies extreme market conditions (tops and bottoms) by aggregating up to 7 independent on-chain and market metrics into a single normalized z-score. Unlike traditional oscillators that analyze only price action, AlphaZ-Score incorporates blockchain fundamentals, investor profitability metrics, and capital flow data to determine where Bitcoin sits within its long-term market cycle.
The output ranges from -3 (extreme oversold/cycle bottom) to +3 (extreme overbought/cycle top), with readings beyond ±2 indicating high-probability reversal zones.
METHODOLOGY - THE 7-COMPONENT SYSTEM
Each component analyzes Bitcoin's market state from a unique perspective, then gets z-scored (statistical normalization) so all metrics can be compared on equal footing. The final score is a weighted average of all enabled indicators.
Default Configuration (3 indicators enabled):
Stablecoin Supply Ratio (SSRO)
MVRV Z-Score
SOPR Z-Score
Optional Advanced Components (4 indicators disabled by default):
Days Higher Streak Valuation (DHSV)
High Probability OB/OS (HPOB)
Risk Index Z-Score
Comprehensive On-chain Z-Score
COMPONENT BREAKDOWN
1. STABLECOIN SUPPLY RATIO OSCILLATOR (SSRO) - ENABLED BY DEFAULT
What it measures: Ratio of Bitcoin market cap to total stablecoin supply (USDT + USDC)
Data sources:
CRYPTOCAP:BTC - Bitcoin market cap
CRYPTOCAP:USDT - Tether market cap
CRYPTOCAP:USDC - USD Coin market cap
Logic:
SSR = BTC Market Cap / (USDT + USDC Supply)
Z-Score = Standardized SSR over 200 periods
Interpretation:
High SSR (positive z-score): Bitcoin overvalued relative to available stablecoin buying power → Overbought
Low SSR (negative z-score): Massive stablecoin reserves relative to BTC value → Potential bottom (dry powder)
Why it works: Stablecoins represent "dry powder" - capital waiting to enter crypto. When stablecoin supply is high relative to BTC value, it signals accumulation potential. When low, it suggests exhausted buying power.
2. MVRV Z-SCORE - ENABLED BY DEFAULT
What it measures: Market Value to Realized Value ratio, z-scored over 520 periods
Data source: INTOTHEBLOCK:BTC_MVRV
Logic:
MVRV = Market Cap / Realized Cap
Z-Score = (MVRV - Mean) / Std Dev
Interpretation:
High MVRV (positive z-score): Average holder in significant profit → Distribution phase
Low MVRV (negative z-score): Average holder near breakeven/loss → Accumulation phase
Why it works: MVRV compares Bitcoin's market price to its "fair value" (realized price = average cost basis of all coins). Extreme deviations historically mark cycle tops (MVRV > 3.5) and bottoms (MVRV < 1.0).
Historical significance:
2017 top: MVRV z-score ~7
2018 bottom: MVRV z-score ~-1.5
2021 top: MVRV z-score ~6
2022 bottom: MVRV z-score ~-1.0
3. SOPR Z-SCORE - ENABLED BY DEFAULT
What it measures: Spent Output Profit Ratio, smoothed and z-scored
Data source: GLASSNODE:BTC_SOPR
Logic:
SOPR = Value of spent outputs / Value at creation
SOPR EMA = 7-period exponential moving average
Z-Score = Standardized SOPR EMA over 180 periods
Interpretation:
SOPR > 1 (positive z-score): Coins being spent at profit → Potential distribution
SOPR < 1 (negative z-score): Coins being spent at loss → Capitulation/bottom
Why it works: SOPR measures aggregate profitability of spent coins. When holders are forced to sell at losses (SOPR < 1), it indicates capitulation and potential bottoms. When everyone sells at profit (SOPR >> 1), it signals euphoria and potential tops.
4. DAYS HIGHER STREAK VALUATION (DHSV) - DISABLED BY DEFAULT
What it measures: Number of historical bars with prices higher than current level
Logic:
For last N bars, count how many had close > current close
Apply streak decay logic based on price threshold
Z-Score result over lookback period
Interpretation:
Few days higher (negative z-score): Price near all-time highs → Potential overbought
Many days higher (positive z-score): Price deep below historical levels → Oversold
Why it works: Measures how "expensive" current price is relative to history. When 90%+ of historical bars are higher, you're near cycle bottoms.
Settings:
Historical Bars (1000): How far back to look
Threshold & Decay: Sensitivity adjustments
5. HIGH PROBABILITY OVERBOUGHT/OVERSOLD (HPOB) - DISABLED BY DEFAULT
What it measures: Volume-weighted price momentum divergence
Logic:
Volume-weighted Hull MA vs Standard Hull MA
Difference normalized by 100-period SMA
Result inverted and scaled to match z-score range
Interpretation:
Positive score: Volume-weighted momentum diverging up → Overbought
Negative score: Volume-weighted momentum diverging down → Oversold
Why it works: When volume-weighted price movement diverges from standard price movement, it reveals institutional vs retail behavior mismatches.
Settings:
SVWHMA Length (50): Volume-weighted smoothing
HMA Length (50): Standard momentum baseline
Smooth Length (50): Final output smoothing
6. RISK INDEX Z-SCORE - DISABLED BY DEFAULT
What it measures: Modified Puell Multiple approach using realized cap
Data sources:
COINMETRICS:BTC_MARKETCAPREAL - Realized market cap
GLASSNODE:BTC_MARKETCAP - Current market cap
Logic:
Delta = Risk Multiplier × Realized Cap - Historical Realized Cap
Risk Index = (Delta / Market Cap × 100) / 24
Z-Score = Standardized Risk Index over 1500 periods
Interpretation:
High risk (positive z-score): Realized cap growth outpacing market cap → Overextended
Low risk (negative z-score): Market cap collapsed relative to realized cap → Undervalued
Why it works: Compares the rate of realized cap change to market cap. Rapid realized cap growth during low market cap periods signals accumulation.
7. COMPREHENSIVE ON-CHAIN Z-SCORE - DISABLED BY DEFAULT
What it measures: Average of three on-chain metrics: NUPL, SOPR, and MVRV
Data sources:
GLASSNODE:BTC_MARKETCAP - Current market cap
COINMETRICS:BTC_MARKETCAPREAL - Realized cap
GLASSNODE:BTC_SOPR - SOPR data
Logic:
NUPL = (Market Cap - Realized Cap) / Market Cap × 100
SOPR Z-Score = (SOPR - Mean) / Std Dev with EMA smoothing
MVRV = Market Cap / Realized Cap
Final Score = Average of all three z-scores
Interpretation:
Combines profitability (NUPL), spending behavior (SOPR), and valuation (MVRV) into single comprehensive on-chain metric.
AGGREGATION METHODOLOGY
Scoring System:
Each enabled indicator produces a z-score (typically -3 to +3 range)
Scores are weighted equally (weight = 1.0 for all)
Final output = Weighted average of all enabled indicators
Why Equal Weighting:
Each metric analyzes fundamentally different aspects of Bitcoin's market state. Equal weighting prevents any single data source from dominating and ensures diversification.
Customization:
Users can enable/disable indicators to:
Simplify analysis (3 core metrics)
Increase complexity (all 7 metrics)
Focus on specific aspects (only on-chain, only market-based, etc.)
INTERPRETATION GUIDE
Z-Score Ranges:
+3.0 and above - EXTREME OVERBOUGHT
Historical cycle tops
Maximum euphoria
High-probability distribution zone
Consider taking profits
+2.0 to +3.0 - OVERBOUGHT
Late bull market phase
Elevated risk
Cautious positioning recommended
-2.0 to +2.0 - NEUTRAL
Normal market conditions
Trend-following strategies appropriate
-2.0 to -3.0 - OVERSOLD
Early accumulation phase
Fear/capitulation stage
Begin DCA strategies
-3.0 and below - EXTREME OVERSOLD
Historical cycle bottoms
Maximum fear
High-probability accumulation zone
Prime buying opportunity
VISUAL COMPONENTS
1. Main Z-Score Line:
Dynamic color gradient based on value
Green shades: Oversold (buying opportunity)
Red shades: Overbought (distribution zone)
White: Neutral
2. Reference Lines:
0: Neutral baseline
±2: Overbought/Oversold thresholds
±3: Extreme zones (highest probability reversals)
3. Background Shading:
Light green: Oversold (-2 to -3)
Bright green: Extreme oversold (< -3)
Light red: Overbought (+2 to +3)
Bright red: Extreme overbought (> +3)
4. Bar Coloring:
Cyan bars: Oversold conditions
Red bars: Overbought conditions
Default: Neutral
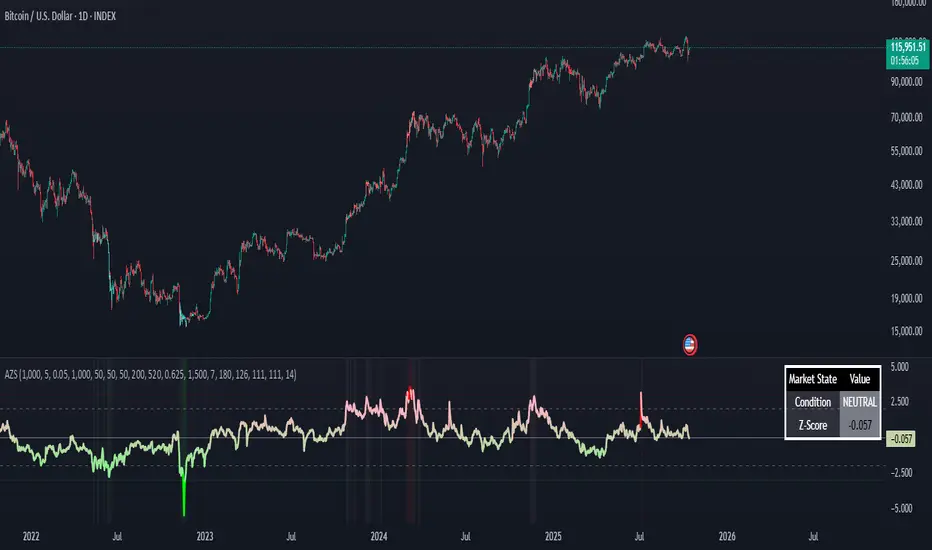
5. Summary Table (Top Right):
Market State: Current condition (Extreme OB/OS, Overbought/Oversold, Neutral)
Z-Score Value: Precise numeric reading
HOW TO USE
For Long-Term Investors (DCA Strategy):
Aggressive accumulation: Z-score < -2 (especially < -3)
Regular accumulation: Z-score between -2 and 0
Hold: Z-score between 0 and +2
Take profits: Z-score > +2 (especially > +3)
For Cycle Traders:
Buy zone: Wait for z-score to drop below -2
Hold through: Ignore noise between -2 and +2
Sell zone: Start distributing when z-score exceeds +2
Exit: Complete exit if z-score reaches +3
Risk Management:
Never buy in extreme overbought (>+3) - Historically always preceded major crashes
Scale into positions - Don't go all-in at any single reading
Use with price action - Confirm with support/resistance levels
Best Timeframes:
1D (Daily): Primary timeframe for cycle analysis
1W (Weekly): Macro cycle perspective
Lower timeframes not recommended (designed for long-term cycles)
SETTINGS CONFIGURATION
General Settings:
Toggle each of 7 indicators on/off
Default: 3 indicators enabled (SSRO, MVRV, SOPR)
Advanced: Enable all 7 for maximum sensitivity
Individual Indicator Settings:
Each indicator has dedicated parameter groups:
DHSV: Historical lookback, threshold decay
HPOB: HMA and VWMA lengths, smoothing
SSRO: Z-score calculation period (200)
MVRV: Z-score length (520)
Risk: Multiplier and z-score length
SOPR: EMA smoothing (7), z-score period (180)
On-chain: Separate lengths for NUPL, SOPR, MVRV components
DATA REQUIREMENTS
Required External Data Sources:
Default configuration (3 indicators):
CRYPTOCAP:BTC - Bitcoin market cap
CRYPTOCAP:USDT - Tether supply
CRYPTOCAP:USDC - USD Coin supply
INTOTHEBLOCK:BTC_MVRV - MVRV ratio
GLASSNODE:BTC_SOPR - SOPR data
Optional indicators require:
GLASSNODE:BTC_MARKETCAP - Market cap (on-chain)
COINMETRICS:BTC_MARKETCAPREAL - Realized cap
Additional Glassnode metrics
Important: This indicator requires TradingView data subscriptions for on-chain metrics. Some data sources may not be available on all accounts.
HISTORICAL PERFORMANCE
Major Cycle Tops Identified:
November 2021: Z-score peaked at ~+2.8 before -50% crash
December 2017: Z-score exceeded +3.0 before -84% bear market
April 2013: Z-score hit extreme overbought before correction
Major Cycle Bottoms Identified:
November 2022: Z-score reached -2.5 before +100% rally
December 2018: Z-score dropped to -2.8 before +300% bull run
January 2015: Z-score hit -3.2 before multi-year bull market
Key Insight: Extreme readings (beyond ±2.5) have preceded major market reversals with high accuracy. The indicator is designed for cycle identification, not short-term trading.
ORIGINALITY - WHY THIS IS UNIQUE
Traditional Cycle Indicators:
Use single metrics (MVRV only, SOPR only, etc.)
No normalization - hard to compare metrics
Fixed thresholds that don't adapt to market evolution
Often proprietary black boxes
AlphaZ-Score Advantages:
Multi-Metric Aggregation: Combines on-chain fundamentals, market structure, and capital flows into single score
Statistical Normalization: Z-scoring allows fair comparison of completely different metrics (market cap ratios vs profitability metrics)
Modular Design: Enable only the metrics you trust or have data access to
Transparent Calculations: All formulas visible in open-source code
Bitcoin-Specific Optimization: Tuned specifically for Bitcoin's 4-year halving cycle and on-chain characteristics
Customizable Weighting: Advanced users can modify weights for different market regimes
Visual Clarity: Single line that clearly shows cycle position, unlike juggling multiple indicators
LIMITATIONS
Requires on-chain data subscriptions - Some metrics need premium TradingView data
Lagging indicator - Identifies cycles after they begin, not predictive
Bitcoin-specific - Not designed for altcoins or traditional markets
Long-term focus - Not suitable for day trading or short-term speculation
Data availability - Historical on-chain data only goes back to ~2010
External dependencies - Relies on Glassnode, CoinMetrics data accuracy
ALERTS
No built-in alerts (indicator designed for visual analysis of long-term cycles). Users can create custom alerts based on z-score thresholds.
BEST PRACTICES
✅ Use on daily or weekly timeframe only
✅ Combine with long-term moving averages (200 MA, 200 WMA)
✅ Wait for extreme readings (beyond ±2) before major decisions
✅ Scale positions - don't go all-in at any single reading
✅ Verify on-chain data sources are updating properly
❌ Don't use for short-term trading (minutes/hours)
❌ Don't ignore price action - confirm with chart patterns
❌ Don't expect perfect timing - cycles can extend beyond extremes
❌ Don't trade solely on this indicator - use as confluence
Not financial advice. This indicator identifies market cycles based on historical patterns and on-chain data. Past performance does not guarantee future results. Always use proper risk management and position sizing.
Skrip jemputan sahaja
Hanya pengguna yang diluluskan oleh penulis boleh mengakses skrip ini. Anda perlu memohon dan mendapatkan kebenaran untuk menggunakannya. Ini selalunya diberikan selepas pembayaran. Untuk lebih butiran, ikuti arahan penulis di bawah atau hubungi terus AlphaEdge_.
TradingView tidak menyarankan pembayaran untuk atau menggunakan skrip kecuali anda benar-benar mempercayai penulisnya dan memahami bagaimana ia berfungsi. Anda juga boleh mendapatkan alternatif sumber terbuka lain yang percuma dalam skrip komuniti kami.
Arahan penulis
Penafian
Skrip jemputan sahaja
Hanya pengguna yang diluluskan oleh penulis boleh mengakses skrip ini. Anda perlu memohon dan mendapatkan kebenaran untuk menggunakannya. Ini selalunya diberikan selepas pembayaran. Untuk lebih butiran, ikuti arahan penulis di bawah atau hubungi terus AlphaEdge_.
TradingView tidak menyarankan pembayaran untuk atau menggunakan skrip kecuali anda benar-benar mempercayai penulisnya dan memahami bagaimana ia berfungsi. Anda juga boleh mendapatkan alternatif sumber terbuka lain yang percuma dalam skrip komuniti kami.