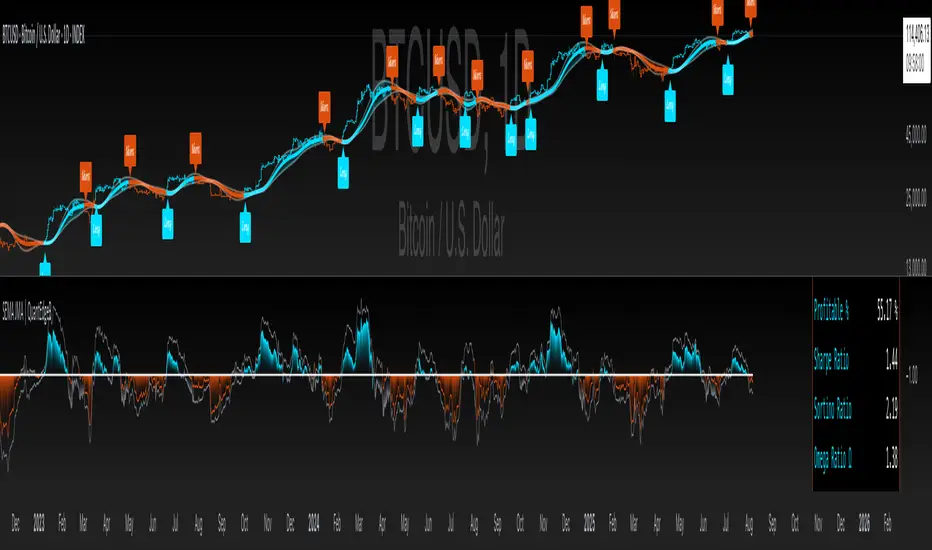
SEMA JMA | QuantEdgeB
📈 Introducing SEMA JMA by QuantEdgeB
🛠️ Overview
SEMA JMA is a precision-engineered, dual-signal trend indicator that blends Jurik Moving Average (JMA) logic with Double Exponential Moving Average (DEMA) smoothing and normalized statistical filters.
This advanced indicator is built for high-quality trend detection, reducing false signals by confirming momentum through both price-based SD bands and normalized JMA logic. The result is a powerful, noise-filtered tool ideal for directional trading in volatile and ranging environments.
SEMA JMA offers adaptive volatility bands, backtest-ready analytics, and dynamic signal labeling, making it a favorite for traders demanding speed, precision, and strategic clarity.
✨ Key Features
🔹 Hybrid JMA + DEMA Core
Combines the ultra-smooth JMA with lag-reducing DEMA for exceptional trend clarity.
🔹 Volatility-Based SD Band Filtering
Uses rolling standard deviation on JMA for adaptive long/short bands that respond to market dynamics.
🔹 Normalized Price Filter Confirmation
A second JMA stream is normalized against price and filtered via SD for added trend confirmation and false signal suppression.
🔹 Backtest Integration & Equity Curve Plotting
Built-in compatibility with QuantEdgeB/BacktestingIndV2, delivering historical metrics, equity visualization, and strategic evaluation.
🔹 Fully Customizable UI
Includes label toggles, signal overlays, visual themes, and backtest table position selection.
📊 How It Works
1️⃣ JMA-DEMA Hybrid Trend Engine
The foundation of SEMA JMA lies in a custom-built JMA engine, enhanced by a DEMA smoothing layer to:
• Minimize lag without losing trend integrity.
• Maintain responsiveness in noisy or low-volume environments.
• Create a central trend structure used by both raw price and normalized filters.
2️⃣ Standard Deviation Band Filtering
SEMA JMA applies a rolling SD filter over the JMA signal. This creates adaptive upper and lower bands:
• Long Signal = Price > Upper Band
• Short Signal = Price < Lower Band
These bands adjust based on price volatility, offering a dynamic alternative to traditional fixed thresholds.
3️⃣ Normalized JMA for Momentum Confirmation
A second JMA-DEMA structure is normalized by dividing by price, then smoothed:
• If the normalized signal rises above -1, it suggests upside pressure.
• If it drops below -1, it signals momentum decay.
Only when both raw and normalized signals agree does the indicator issue a trade trigger.
✅ Signal Logic
📌 Long Signal →
🔹 Price breaks above volatility-adjusted upper SD band
🔹 AND Normalized JMA rises above -1
📌 Short Signal →
🔹 Price breaks below lower SD band
🔹 AND Normalized JMA falls below -1
⚙️ SEMA JMA stays in its active trend state until an opposing signal triggers, enabling tren riding while filtering short lived swings.
👥 Who Should Use It?
✅ Swing & Trend Traders → Ride strong directional moves with reduced whipsaws
✅ Volatility-Adaptive Systems → Filter trades using rolling SD-based thresholds
✅ Quantitative Strategy Builders → Deploy within algo-driven strategies using backtest-ready metrics
✅ Risk-Aware Traders → Use dual confirmation to minimize signal risk
⚙️ Customization & Default Settings
🔧 Core Settings:
• JMA Length (Default: 35) → Defines JMA sensitivity.
• DEMA Length (Default: 20) → Smoothing after JMA to refine structure.
• Normalized JMA Lengths → Control confirmation layer smoothness (default: 1 for short and long).
• Standard Deviation Length (Default: 30) → Determines the volatility lookback.
• SD Weight Factors → Separate values for long (default: 1.0) and short (default: 1.002) bands.
📊 Backtest Mode
SEMA JMA includes an optional backtest table, enabling traders to assess its historical effectiveness before applying it in live trading conditions.
🔹 Backtest Metrics Displayed:
• Equity Max Drawdown → Largest historical loss from peak equity.
• Profit Factor → Ratio of total profits to total losses, measuring system efficiency.
• Sharpe Ratio → Assesses risk-adjusted return performance.
• Sortino Ratio → Focuses on downside risk-adjusted returns.
• Omega Ratio → Evaluates return consistency & performance asymmetry.
• Half Kelly → Optimal position sizing based on risk/reward analysis.
• Total Trades & Win Rate → Assess historical success rate.
📌 Disclaimer:
Backtest results are based on past performance and do not guarantee future success. Always incorporate real-time validation and risk management in live trading.
🚀 Why This Matters?
✅ Strategy Validation → Gain insight into historical trend accuracy.
✅ Customization Insights → See how different settings impact performance.
✅ Risk Awareness → Understand potential drawdowns before deploying capital.
📌 How to Use SEMA JMA
🌀 Trend-Following Strategy
✔ Go Long: When price breaks above SD band and normalized momentum rises
✔ Go Short: When price breaks below SD band and normalized momentum falls
✔ Stay in position: Until signal reversal confirms
⚙️ Volatility-Adaptive Configuration
✔ Tune w1 (Long SD weight) and w2 (Short SD weight) for responsiveness
✔ Increase SD length in noisy markets for smoother bands
📌 Conclusion
SEMA JMA by QuantEdgeB delivers surgical precision trend signals using a dual-layer approach:
• JMA + DEMA core smoothing
• Statistical SD breakout filters
• Normalized confirmation logic
It’s a versatile indicator suited for trend-following, volatility tracking, and system-based signal generation—engineered for clarity, confidence, and adaptability.
🔹 Key Takeaways:
1️⃣ Multi-Filter Trend Logic – JMA + DEMA + Normalized filtering for high-confidence signals
2️⃣ SD-Based Volatility Control – Reduces noise, avoids ATR limitations
3️⃣ Quant-Ready System – Includes full backtesting
📌 Master your market edge with precision – SEMA JMA | QuantEdgeB
🔹 Disclaimer: Past performance is not indicative of future results.
🔹 Strategic Advice: Always backtest, optimize, and align parameters with your trading objectives and risk tolerance before live trading.
Skrip jemputan sahaja
Hanya pengguna disahkan oleh penulis boleh mengakses skrip ini. Anda perlu memohon dan mendapatkan kebenaran untuk menggunakannya. Keizinan selalunya diberikan selepas pembayaran. Untuk lebih butiran, ikuti arahan penulis di bawah atau hubungi QuantEdgeB secara terus.
TradingView TIDAK menyarankan pembayaran atau penggunaan skrip kecuali anda mempercayai sepenuhnya penulis dan memahami bagaimana ia berfungsi. Anda juga boleh menjumpai alternatif sumber terbuka dan percuma yang lain di dalam skrip komuniti kami.
Arahan penulis
whop.com/quantedgeb/ 💎
🔹 Unlock our free toolbox:
tradinglibrary.carrd.co/ 🛠️
Disclaimer: All resources and indicators provided are for educational purposes only
Penafian
Skrip jemputan sahaja
Hanya pengguna disahkan oleh penulis boleh mengakses skrip ini. Anda perlu memohon dan mendapatkan kebenaran untuk menggunakannya. Keizinan selalunya diberikan selepas pembayaran. Untuk lebih butiran, ikuti arahan penulis di bawah atau hubungi QuantEdgeB secara terus.
TradingView TIDAK menyarankan pembayaran atau penggunaan skrip kecuali anda mempercayai sepenuhnya penulis dan memahami bagaimana ia berfungsi. Anda juga boleh menjumpai alternatif sumber terbuka dan percuma yang lain di dalam skrip komuniti kami.
Arahan penulis
whop.com/quantedgeb/ 💎
🔹 Unlock our free toolbox:
tradinglibrary.carrd.co/ 🛠️
Disclaimer: All resources and indicators provided are for educational purposes only