OPEN-SOURCE SCRIPT
Madrid Donchian SEC bar
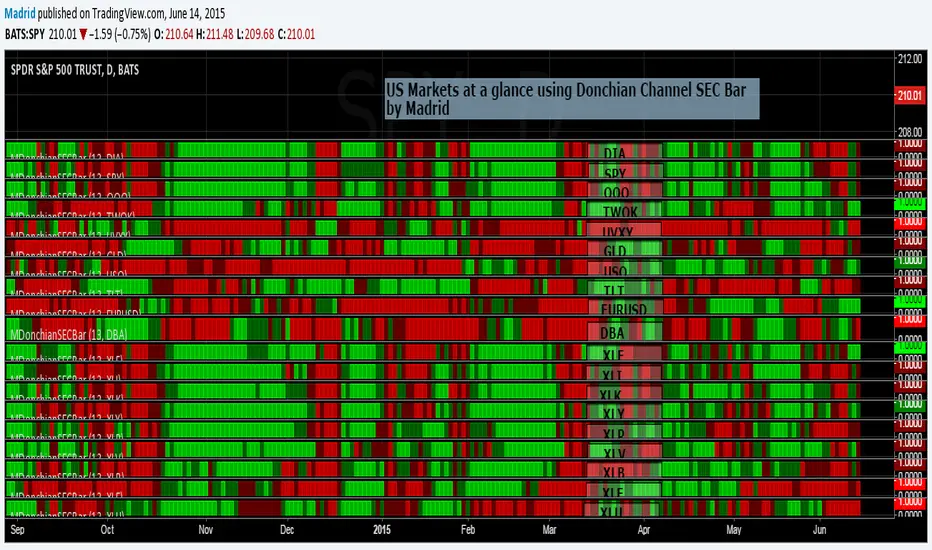
This study is based on the Donchain Channel Bar indicator but this adds security as a parameter. This allows several instances of this indicator to be used in the same page to create a heat map to take look at a glance at several securities, just like the example where this was implemented.
The only two parameters it requires are the security symbol and the length of the analysis.
The only two parameters it requires are the security symbol and the length of the analysis.
Skrip sumber terbuka
Dalam semangat sebenar TradingView, pencipta skrip ini telah menjadikannya sumber terbuka supaya pedagang dapat menilai dan mengesahkan kefungsiannya. Terima kasih kepada penulis! Walaupun anda boleh menggunakannya secara percuma, ingat bahawa menerbitkan semula kod ini adalah tertakluk kepada Peraturan Dalaman kami.
Penerbitan berkaitan
Penafian
Maklumat dan penerbitan adalah tidak dimaksudkan untuk menjadi, dan tidak membentuk, nasihat untuk kewangan, pelaburan, perdagangan dan jenis-jenis lain atau cadangan yang dibekalkan atau disahkan oleh TradingView. Baca dengan lebih lanjut di Terma Penggunaan.