OPEN-SOURCE SCRIPT
Telah dikemas kini Volume Variation Index Indicator
This tool is a quantitative tip for analysts who study volumes or create volume based trading strategies.
Like all our projects, we start with a statistical logic to which we add coding logic.
This indicator can save a huge amount of time in calculating the variation of volume between sessions.
How it work
The indicator calculates the difference between the volume of the last closing bar and the volume of the previous closing bar. It shows the difference between the trading volumes.
The session in which the trading volume is up are represented in green.
Red session represent trading volume down.
We have added a third function.
Through the User Interface the trader can activate or deactivate the variation average.
The indicator is able to calculate the average of the volume changes by representing it with a blue line.
To activate the average, simply set it to ON in the User Interface.
By default, the indicator calculates the average of the last 10 periods, but you are free to set this parameter in the User Interface.
Data access
To access the data, simply move the cursor. When you move the cursor over the green bars, the increase data will be displayed in green. By hovering the cursor over the red bars you will see the decrease data in red. By hovering the cursor over the average will show you the average data in blue.
The data is displayed in the top left corner of the indicator dashboard.
If you found this indicator helpful, please like our script.
Nota Keluaran
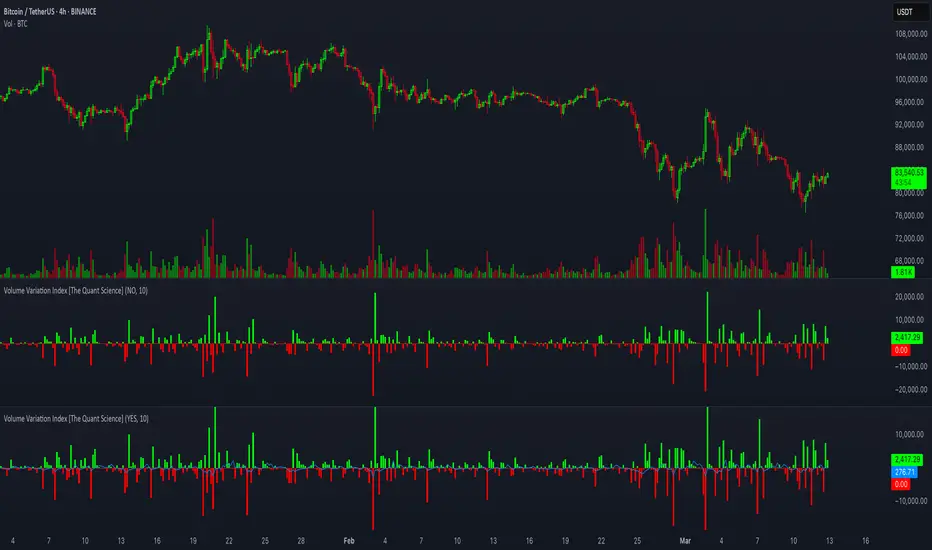
This tool is a quantitative tip for analysts who study volumes or create volume based trading strategies, calculating the variation of volume between bars.How it work
The indicator calculates the difference between the volume of the last closing bar and the volume of the previous closing bar. It shows the difference between the trading volumes.
When trading volume is up bars are represented in green.
When trading volume is down bars are represented in red.
Extra Function
Through the User Interface the user can activate or deactivate the variation average.
The indicator is able to calculate the average of the volume changes by representing it with a blue line. To activate the average, simply set it 'ON' in the User Interface. By default, the indicator calculates the average of the last 10 periods, but you are free to change this parameter.
Data access
To access the data, simply move the cursor. When you move the cursor over the green bars, the increase data will be displayed in green. By hovering the cursor over the red bars you will see the decrease data in red. By hovering the cursor over the average will show you the average data in blue. The data is displayed in the top left corner of the indicator dashboard.
If you found this indicator helpful, please like our script.
Code update to Pine Script V6
Skrip sumber terbuka
Dalam semangat TradingView sebenar, pencipta skrip ini telah menjadikannya sumber terbuka, jadi pedagang boleh menilai dan mengesahkan kefungsiannya. Terima kasih kepada penulis! Walaupuan anda boleh menggunakan secara percuma, ingat bahawa penerbitan semula kod ini tertakluk kepada Peraturan Dalaman.
Penafian
Maklumat dan penerbitan adalah tidak bertujuan, dan tidak membentuk, nasihat atau cadangan kewangan, pelaburan, dagangan atau jenis lain yang diberikan atau disahkan oleh TradingView. Baca lebih dalam Terma Penggunaan.