OPEN-SOURCE SCRIPT
Telah dikemas kini Median Deviation Bands | QuantumResearch
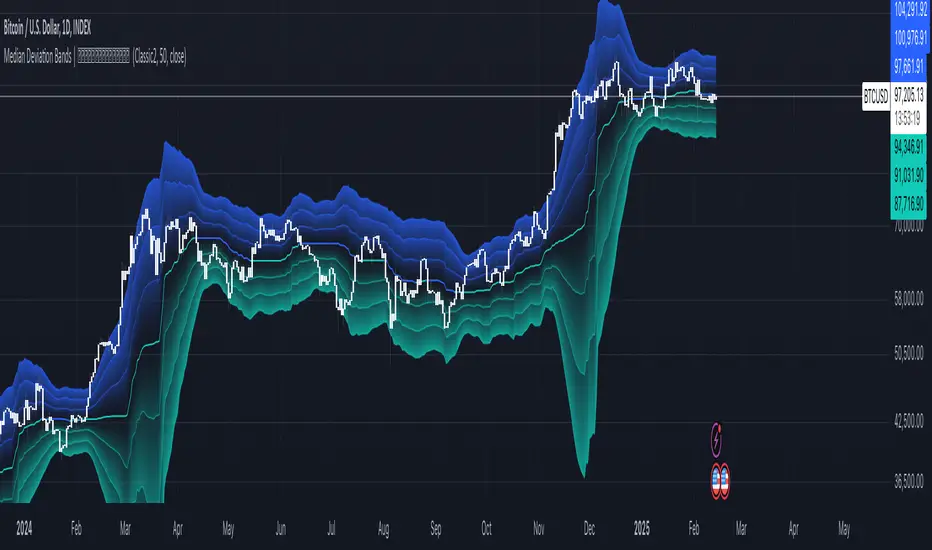
Introducing QuantumResearch’s Median Deviation Bands Indicator
The Median Deviation Bands indicator is an advanced volatility-based tool designed to help traders identify price trends, market reversals, and potential trading opportunities.
By using a percentile-based median baseline combined with standard deviation bands, this indicator provides a dynamic framework for analyzing price movements and assessing market volatility.
- How It Works
Baseline Calculation:
The median price over a user-defined period (default: 50) is calculated using the 50th percentile of price data.
This serves as the central reference point for trend analysis.
Trend Identification:
Bullish Trend: Occurs when the price crosses above the baseline.
Bearish Trend: Occurs when the price crosses below the baseline.
Deviation Bands:
The indicator plots three sets of upper and lower bands, representing 1x, 2x, and 3x standard deviations from the median.
These bands act as dynamic support and resistance zones, helping traders identify overbought and oversold conditions. - Visual Representation
The Median Deviation Bands indicator offers a clear, customizable visual layout: - Color-Coded Baseline:
Green (Bullish): Price is above the median.
Red (Bearish): Price is below the median.
Deviation Bands:
First Band (Light Fill): Represents 1 standard deviation from the baseline.
Second Band (Medium Fill): Represents 2 standard deviations, highlighting stronger trends.
Third Band (Dark Fill): Represents 3 standard deviations, showing extreme price conditions. - Trend Markers:
Green Up Arrows: Indicate the start of a bullish trend when price crosses above the baseline.
Red Down Arrows: Indicate the start of a bearish trend when price crosses below the baseline. - Customization & Parameters
The Median Deviation Bands indicator includes multiple user-configurable settings to adapt to different trading strategies:
Baseline Length: Default set to 50, determines the lookback period for median calculation.
Source Price: Selectable input price for calculations (default: close).
Band Visibility: Traders can toggle individual deviation bands on or off to match their preferences.
Trend Markers: Option to enable or disable up/down trend arrows.
Color Modes: Choose from eight color schemes to customize the indicator’s appearance. - Trading Applications
This indicator is highly versatile and can be applied to multiple trading strategies, including:
Volatility-Based Trading: Price movement within and outside the bands helps traders gauge volatility and market conditions.
Trend Following: The baseline and deviation bands help confirm ongoing trends.
Mean Reversion Strategies: Traders can look for price reactions at extreme bands (±3 standard deviations). - Final Note
QuantumResearch’s Median Deviation Bands indicator provides a unique approach to market analysis by integrating percentile-based median price levels with standard deviation-based volatility bands.
This combination helps traders understand price behavior in relation to historical volatility, making it a valuable tool for both trend-following and mean-reversion strategies.
As always, backtesting and customization are recommended to optimize performance across different market conditions.
Nota Keluaran
Adding the step.Nota Keluaran
Added alert conditionSkrip sumber terbuka
Dalam semangat TradingView sebenar, pencipta skrip ini telah menjadikannya sumber terbuka, jadi pedagang boleh menilai dan mengesahkan kefungsiannya. Terima kasih kepada penulis! Walaupuan anda boleh menggunakan secara percuma, ingat bahawa penerbitan semula kod ini tertakluk kepada Peraturan Dalaman.
🌐 Gain access to our cutting-edge tools:
whop.com/quantum-whop/
⚒️ Get access to our toolbox here for free:
quantumresearchportfolio.carrd.co
All tools and content provided are for informational and educational purposes only.
whop.com/quantum-whop/
⚒️ Get access to our toolbox here for free:
quantumresearchportfolio.carrd.co
All tools and content provided are for informational and educational purposes only.
Penafian
Maklumat dan penerbitan adalah tidak bertujuan, dan tidak membentuk, nasihat atau cadangan kewangan, pelaburan, dagangan atau jenis lain yang diberikan atau disahkan oleh TradingView. Baca lebih dalam Terma Penggunaan.
Skrip sumber terbuka
Dalam semangat TradingView sebenar, pencipta skrip ini telah menjadikannya sumber terbuka, jadi pedagang boleh menilai dan mengesahkan kefungsiannya. Terima kasih kepada penulis! Walaupuan anda boleh menggunakan secara percuma, ingat bahawa penerbitan semula kod ini tertakluk kepada Peraturan Dalaman.
🌐 Gain access to our cutting-edge tools:
whop.com/quantum-whop/
⚒️ Get access to our toolbox here for free:
quantumresearchportfolio.carrd.co
All tools and content provided are for informational and educational purposes only.
whop.com/quantum-whop/
⚒️ Get access to our toolbox here for free:
quantumresearchportfolio.carrd.co
All tools and content provided are for informational and educational purposes only.
Penafian
Maklumat dan penerbitan adalah tidak bertujuan, dan tidak membentuk, nasihat atau cadangan kewangan, pelaburan, dagangan atau jenis lain yang diberikan atau disahkan oleh TradingView. Baca lebih dalam Terma Penggunaan.