PROTECTED SOURCE SCRIPT
Sholi Auto Levels
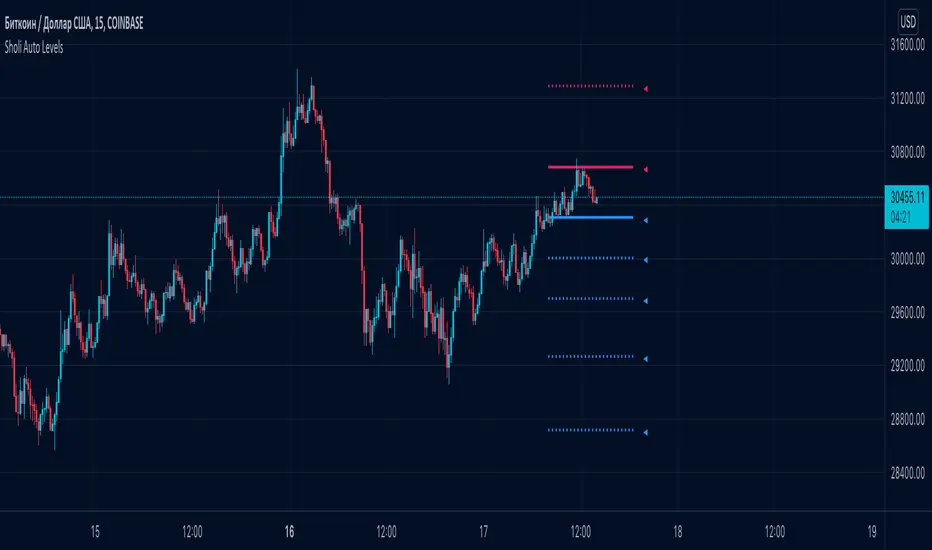
◾️ Auto levels are calculated for each timeframe separately. The script builds fibonacci levels once in a certain period for each of the timeframes. With the help of previously found support and resistance levels, high and low values, the indicator determines the most accurate distribution of fibonacci levels.
Extremely convenient for use in Technical Analysis. You can define rise or fall correction levels by the specified levels.
◾️ How to use?
Blue levels - support. Red - resistance. If you hover over the pointer near the level, you can see detailed information.
As a rule, the price moves at the indicated levels. It lingers on them and tries to break through or find support.
◾️ What is useful for you?
You will be able to build your own analytics based on clear levels that ideally determine the potential for movement in the market.
Skrip dilindungi
Skrip ini diterbitkan sebagai sumber tertutup. Akan tetapi, anda boleh menggunakannya dengan percuma dan tanpa had – ketahui lebih lanjut di sini.
Penafian
Maklumat dan penerbitan adalah tidak dimaksudkan untuk menjadi, dan tidak membentuk, nasihat untuk kewangan, pelaburan, perdagangan dan jenis-jenis lain atau cadangan yang dibekalkan atau disahkan oleh TradingView. Baca dengan lebih lanjut di Terma Penggunaan.