OPEN-SOURCE SCRIPT
3D Session Clock | Live Time with Sessions [CHE]
3D Session Clock | Live Time with Sessions [CHE] — Projects a perspective clock face onto the chart to display current time and market session periods for enhanced situational awareness during trading hours.
Summary
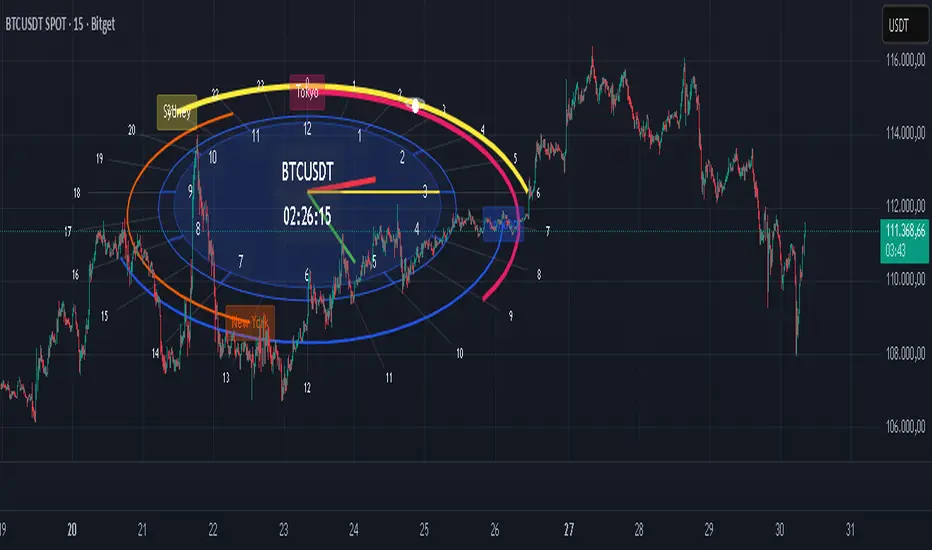
This indicator renders a three-dimensional clock projection directly on the price chart, showing analog hands for hours, minutes, and seconds alongside a digital time readout. It overlays session arcs for major markets like New York, London, Tokyo, and Sydney, highlighting the active one with thicker lines and contrasting labels. By centralizing time and session visibility, it reduces the need to reference external clocks, allowing traders to maintain focus on price action while noting overlaps or transitions that influence volatility.
The design uses perspective projection to simulate depth, making the clock appear tilted for better readability on varying chart scales. Sessions are positioned radially outward from the main clock, with the current time marker pulsing on the relevant arc. This setup provides a static yet live-updating view, confirmed on bar close to avoid intrabar shifts.
Motivation: Why this design?
Traders often miss subtle session shifts amid fast-moving charts, leading to entries during low-liquidity periods or exits before peak activity. Standard chart tools lack integrated time visualization, forcing constant tab-switching. This indicator addresses that by embedding a customizable clock with session rings, ensuring time context is always in view without disrupting workflow.
What’s different vs. standard approaches?
- Reference baseline: Traditional session highlighters use simple background fills or vertical lines, which clutter the chart and ignore global time zones.
- Architecture differences:
- Perspective projection rotates and scales points to mimic 3D depth, unlike flat 2D drawings.
- Nested radial arcs for sessions, with dynamic radius assignment to avoid overlap.
- Live time calculation adjusted for user-selected time zones, including optional daylight savings offset.
- Practical effect: The tilted view prevents labels from bunching at chart edges, and active session emphasis draws the eye to liquidity hotspots, making multi-session overlaps immediately apparent for better timing.
How it works (technical)
The indicator calculates current time in the selected time zone by adjusting the system timestamp with a fixed offset, plus an optional one-hour bump for daylight savings. This yields hour, minute, and second values that drive hand positions: the hour hand advances slowly with fractional minute input, the minute hand ticks per 60 seconds, and the second hand sweeps fully each minute.
Points for the clock face and arcs are generated as arrays of coordinates, transformed via rotation around the x-axis to apply tilt, then projected onto chart space using a scaling factor based on depth. Radial lines mark every hour from zero to 23, extending to the outermost session ring. Session arcs span user-defined hour ranges, drawn as open polylines with step interpolation for smoothness.
On the last bar, all prior drawings are cleared, and new elements are added: filled clock circles, hand lines from center to tip, a small orbiting circle at the current time position, and centered labels for hours, sessions, and time. The active session is identified by checking if the current time falls within its range, then its arc thickens and label inverts colors. Initialization populates a timezone array once, with persistent bar time tracking for horizontal positioning.
Parameter Guide
Clock Size — Controls overall radius in pixels, affecting visibility on dense charts — Default: 200 — Larger values suit wide screens but may crowd small views; start smaller for mobile.
Camera Angle — Sets tilt from top-down (zero) to side (90 degrees), altering projection depth — Default: 45 — Steeper angles enhance readability on sloped trends but flatten at extremes.
Resolution — Defines polygon sides for circles and arcs, balancing smoothness and draw calls — Default: 64 — Higher improves curves on large clocks; lower aids performance on slow devices.
Hour/Minute/Second Hand Length — Scales each hand from center, with seconds longest for precision — Defaults: 100/150/180 — Proportional sizing prevents overlap; shorten for compact layouts.
Clock Base Color — Tints face and frame — Default: blue — Neutral shades reduce eye strain; match chart theme.
Hand Colors — Assigns distinct hues to each hand — Defaults: red/green/yellow — High contrast aids quick scans; avoid chart-matching to stand out.
Hour Label Size — Text scale for 1-12 markers — Default: normal — Larger for distant views, but risks clutter.
Digital Time Size — Scale for HH:MM:SS readout — Default: large — Matches clock for balance; tiny for minimalism.
Digital Time Vertical Offset — Shifts readout up (negative) or down — Default: -50 — Positions above clock to avoid hand interference.
Timezone — Selects reference city/offset — Default: New York (UTC-05) — Matches trading locale; verify offsets manually.
Summer Time (DST) — Adds one hour if active — Default: false — Enable for regions observing it; test transitions.
Show/Label/Session/Color for Each Market — Toggles arc, sets name, time window, and hue per session (New York/London/Tokyo/Sydney) — Defaults: true/"New York"/1300-2200/orange, etc. — Customize windows to local exchange hours; colors differentiate overlaps.
Reading & Interpretation
The analog face shows a blue-tinted circle with white 1-12 labels and gray hour ticks; hands extend from center in assigned colors, pointing to current positions. A white dot with orbiting ring marks exact time on the session arc. Digital readout below displays padded HH:MM:SS in white on black.
Active sessions glow with bold arcs and white labels on colored backgrounds; inactive ones use thin lines and colored text on light fills. Overlaps stack outward, with the innermost (New York) closest to the clock. If no session is active, the marker sits on the base ring.
Practical Workflows & Combinations
- Trend following: Enter longs during London-New York overlap (thicker dual arcs) confirmed by higher highs; filter with volume spikes.
- Exits/Stops: Tighten stops pre-Tokyo open if arc thickens, signaling volatility ramp; trail during Sydney for overnight holds.
- Multi-asset/Multi-TF: Defaults work across forex/stocks; on higher timeframes, enlarge clock size to counter bar spacing. Pair with session volume oscillators for confirmation.
Behavior, Constraints & Performance
Rendering occurs only on the last bar, using confirmed history for stable display; live bars update hands and marker without repainting prior elements. No security calls or higher timeframe fetches, so no lookahead bias.
Resource limits include 2000 bars back for positioning, 500 each for lines, labels, and boxes—sufficient for full sessions without overflow. Arrays hold timezone data statically. On very wide charts, projection may skew slightly due to fixed scale.
Known limits: Visual positioning drifts on extreme zooms; daylight savings assumes manual toggle, risking one-hour errors during changes.
Sensible Defaults & Quick Tuning
Start with New York timezone, 45-degree tilt, and all sessions enabled—these balance global coverage without clutter. For too-small visibility, bump clock size to 300 and resolution to 48. If labels overlap on narrow views, reduce hand lengths proportionally. To emphasize one session (e.g., London), disable others and widen its color contrast. For minimalism, set digital size to small and offset to -100.
What this indicator is—and isn’t
This is a visual time and session overlay to contextualize trading windows, not a signal generator or predictive tool. It complements price analysis and risk rules but requires manual interpretation. Use alongside order flow or momentum indicators for decisions.
Disclaimer
The content provided, including all code and materials, is strictly for educational and informational purposes only. It is not intended as, and should not be interpreted as, financial advice, a recommendation to buy or sell any financial instrument, or an offer of any financial product or service. All strategies, tools, and examples discussed are provided for illustrative purposes to demonstrate coding techniques and the functionality of Pine Script within a trading context.
Any results from strategies or tools provided are hypothetical, and past performance is not indicative of future results. Trading and investing involve high risk, including the potential loss of principal, and may not be suitable for all individuals. Before making any trading decisions, please consult with a qualified financial professional to understand the risks involved.
By using this script, you acknowledge and agree that any trading decisions are made solely at your discretion and risk.
Do not use this indicator on Heikin-Ashi, Renko, Kagi, Point-and-Figure, or Range charts, as these chart types can produce unrealistic results for signal markers and alerts.
Best regards and happy trading
Chervolino
Acknowledgments
This indicator draws inspiration from the open-source contributions of the TradingView community, whose advanced programming techniques have greatly influenced its development. Special thanks to LonesomeTheBlue for the innovative polyline handling and midpoint centering techniques in RSI Radar Multi Time Frame: de.tradingview.com/script/8UtWhfo3-RSI-Radar-Multi-Time-Frame/.
Gratitude also extends to LuxAlgo for the precise timezone calculations in Sessions: de.tradingview.com/script/bkb6vZDz-Sessions-LuxAlgo/.
Finally, appreciation to TradingView for their comprehensive documentation on polyline features, including the support article at tradingview.com/support/solutions/43000516986-polyline and the blog post at tradingview.com/blog/en/pine-script-polyline-drawings-41467. These resources were instrumental in implementing smooth, dynamic drawings.
Summary
This indicator renders a three-dimensional clock projection directly on the price chart, showing analog hands for hours, minutes, and seconds alongside a digital time readout. It overlays session arcs for major markets like New York, London, Tokyo, and Sydney, highlighting the active one with thicker lines and contrasting labels. By centralizing time and session visibility, it reduces the need to reference external clocks, allowing traders to maintain focus on price action while noting overlaps or transitions that influence volatility.
The design uses perspective projection to simulate depth, making the clock appear tilted for better readability on varying chart scales. Sessions are positioned radially outward from the main clock, with the current time marker pulsing on the relevant arc. This setup provides a static yet live-updating view, confirmed on bar close to avoid intrabar shifts.
Motivation: Why this design?
Traders often miss subtle session shifts amid fast-moving charts, leading to entries during low-liquidity periods or exits before peak activity. Standard chart tools lack integrated time visualization, forcing constant tab-switching. This indicator addresses that by embedding a customizable clock with session rings, ensuring time context is always in view without disrupting workflow.
What’s different vs. standard approaches?
- Reference baseline: Traditional session highlighters use simple background fills or vertical lines, which clutter the chart and ignore global time zones.
- Architecture differences:
- Perspective projection rotates and scales points to mimic 3D depth, unlike flat 2D drawings.
- Nested radial arcs for sessions, with dynamic radius assignment to avoid overlap.
- Live time calculation adjusted for user-selected time zones, including optional daylight savings offset.
- Practical effect: The tilted view prevents labels from bunching at chart edges, and active session emphasis draws the eye to liquidity hotspots, making multi-session overlaps immediately apparent for better timing.
How it works (technical)
The indicator calculates current time in the selected time zone by adjusting the system timestamp with a fixed offset, plus an optional one-hour bump for daylight savings. This yields hour, minute, and second values that drive hand positions: the hour hand advances slowly with fractional minute input, the minute hand ticks per 60 seconds, and the second hand sweeps fully each minute.
Points for the clock face and arcs are generated as arrays of coordinates, transformed via rotation around the x-axis to apply tilt, then projected onto chart space using a scaling factor based on depth. Radial lines mark every hour from zero to 23, extending to the outermost session ring. Session arcs span user-defined hour ranges, drawn as open polylines with step interpolation for smoothness.
On the last bar, all prior drawings are cleared, and new elements are added: filled clock circles, hand lines from center to tip, a small orbiting circle at the current time position, and centered labels for hours, sessions, and time. The active session is identified by checking if the current time falls within its range, then its arc thickens and label inverts colors. Initialization populates a timezone array once, with persistent bar time tracking for horizontal positioning.
Parameter Guide
Clock Size — Controls overall radius in pixels, affecting visibility on dense charts — Default: 200 — Larger values suit wide screens but may crowd small views; start smaller for mobile.
Camera Angle — Sets tilt from top-down (zero) to side (90 degrees), altering projection depth — Default: 45 — Steeper angles enhance readability on sloped trends but flatten at extremes.
Resolution — Defines polygon sides for circles and arcs, balancing smoothness and draw calls — Default: 64 — Higher improves curves on large clocks; lower aids performance on slow devices.
Hour/Minute/Second Hand Length — Scales each hand from center, with seconds longest for precision — Defaults: 100/150/180 — Proportional sizing prevents overlap; shorten for compact layouts.
Clock Base Color — Tints face and frame — Default: blue — Neutral shades reduce eye strain; match chart theme.
Hand Colors — Assigns distinct hues to each hand — Defaults: red/green/yellow — High contrast aids quick scans; avoid chart-matching to stand out.
Hour Label Size — Text scale for 1-12 markers — Default: normal — Larger for distant views, but risks clutter.
Digital Time Size — Scale for HH:MM:SS readout — Default: large — Matches clock for balance; tiny for minimalism.
Digital Time Vertical Offset — Shifts readout up (negative) or down — Default: -50 — Positions above clock to avoid hand interference.
Timezone — Selects reference city/offset — Default: New York (UTC-05) — Matches trading locale; verify offsets manually.
Summer Time (DST) — Adds one hour if active — Default: false — Enable for regions observing it; test transitions.
Show/Label/Session/Color for Each Market — Toggles arc, sets name, time window, and hue per session (New York/London/Tokyo/Sydney) — Defaults: true/"New York"/1300-2200/orange, etc. — Customize windows to local exchange hours; colors differentiate overlaps.
Reading & Interpretation
The analog face shows a blue-tinted circle with white 1-12 labels and gray hour ticks; hands extend from center in assigned colors, pointing to current positions. A white dot with orbiting ring marks exact time on the session arc. Digital readout below displays padded HH:MM:SS in white on black.
Active sessions glow with bold arcs and white labels on colored backgrounds; inactive ones use thin lines and colored text on light fills. Overlaps stack outward, with the innermost (New York) closest to the clock. If no session is active, the marker sits on the base ring.
Practical Workflows & Combinations
- Trend following: Enter longs during London-New York overlap (thicker dual arcs) confirmed by higher highs; filter with volume spikes.
- Exits/Stops: Tighten stops pre-Tokyo open if arc thickens, signaling volatility ramp; trail during Sydney for overnight holds.
- Multi-asset/Multi-TF: Defaults work across forex/stocks; on higher timeframes, enlarge clock size to counter bar spacing. Pair with session volume oscillators for confirmation.
Behavior, Constraints & Performance
Rendering occurs only on the last bar, using confirmed history for stable display; live bars update hands and marker without repainting prior elements. No security calls or higher timeframe fetches, so no lookahead bias.
Resource limits include 2000 bars back for positioning, 500 each for lines, labels, and boxes—sufficient for full sessions without overflow. Arrays hold timezone data statically. On very wide charts, projection may skew slightly due to fixed scale.
Known limits: Visual positioning drifts on extreme zooms; daylight savings assumes manual toggle, risking one-hour errors during changes.
Sensible Defaults & Quick Tuning
Start with New York timezone, 45-degree tilt, and all sessions enabled—these balance global coverage without clutter. For too-small visibility, bump clock size to 300 and resolution to 48. If labels overlap on narrow views, reduce hand lengths proportionally. To emphasize one session (e.g., London), disable others and widen its color contrast. For minimalism, set digital size to small and offset to -100.
What this indicator is—and isn’t
This is a visual time and session overlay to contextualize trading windows, not a signal generator or predictive tool. It complements price analysis and risk rules but requires manual interpretation. Use alongside order flow or momentum indicators for decisions.
Disclaimer
The content provided, including all code and materials, is strictly for educational and informational purposes only. It is not intended as, and should not be interpreted as, financial advice, a recommendation to buy or sell any financial instrument, or an offer of any financial product or service. All strategies, tools, and examples discussed are provided for illustrative purposes to demonstrate coding techniques and the functionality of Pine Script within a trading context.
Any results from strategies or tools provided are hypothetical, and past performance is not indicative of future results. Trading and investing involve high risk, including the potential loss of principal, and may not be suitable for all individuals. Before making any trading decisions, please consult with a qualified financial professional to understand the risks involved.
By using this script, you acknowledge and agree that any trading decisions are made solely at your discretion and risk.
Do not use this indicator on Heikin-Ashi, Renko, Kagi, Point-and-Figure, or Range charts, as these chart types can produce unrealistic results for signal markers and alerts.
Best regards and happy trading
Chervolino
Acknowledgments
This indicator draws inspiration from the open-source contributions of the TradingView community, whose advanced programming techniques have greatly influenced its development. Special thanks to LonesomeTheBlue for the innovative polyline handling and midpoint centering techniques in RSI Radar Multi Time Frame: de.tradingview.com/script/8UtWhfo3-RSI-Radar-Multi-Time-Frame/.
Gratitude also extends to LuxAlgo for the precise timezone calculations in Sessions: de.tradingview.com/script/bkb6vZDz-Sessions-LuxAlgo/.
Finally, appreciation to TradingView for their comprehensive documentation on polyline features, including the support article at tradingview.com/support/solutions/43000516986-polyline and the blog post at tradingview.com/blog/en/pine-script-polyline-drawings-41467. These resources were instrumental in implementing smooth, dynamic drawings.
Skrip sumber terbuka
Dalam semangat sebenar TradingView, pencipta skrip ini telah menjadikannya sumber terbuka supaya pedagang dapat menilai dan mengesahkan kefungsiannya. Terima kasih kepada penulis! Walaupun anda boleh menggunakannya secara percuma, ingat bahawa menerbitkan semula kod ini adalah tertakluk kepada Peraturan Dalaman kami.
Penafian
Maklumat dan penerbitan adalah tidak dimaksudkan untuk menjadi, dan tidak membentuk, nasihat untuk kewangan, pelaburan, perdagangan dan jenis-jenis lain atau cadangan yang dibekalkan atau disahkan oleh TradingView. Baca dengan lebih lanjut di Terma Penggunaan.