INVITE-ONLY SCRIPT
Bitcoin: Confidence Bands
Telah dikemas kini
Purpose of this Script
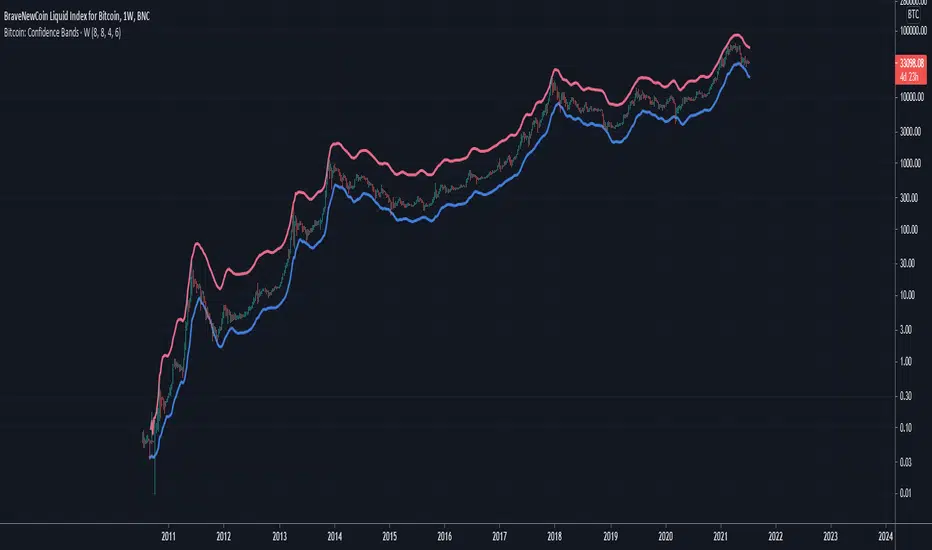
This script is designed to show regions of positive and negative overextension for Bitcoin, where price is expected to either reverse long-term or at least shorter-term, using custom price loops. The idea is that one can be highly confident that Bitcoin's price stays within the Confidence Bands, especially when looking at weekly closes. It might be wise to reduce exposure to Bitcoin when price gets very near to the red band, and vice versa for an approach of the blue band. Of course this constitutes no financial advice, and one should always consider all available information for making trading decisions.
Settings
This indicator should only be used:
- with the default inputs (but of course feel free to play around a bit for testing purposes)
- on the weekly (W) time frame
- and for the BraveNewCoin Liquid Index for Bitcoin (BNC:BLX).
Otherwise the intended functionality cannot be guaranteed.
Access
For access please contact me via DM on TradingView or on Twitter (linked on my TradingView profile and in my signature).
Nota Keluaran
Added Accumulation Bands that can be used during the cycle accumulation phase to identify regions of over- and underextension. The accumulation phase is here defined as starting from the absolute cycle bottom and ending at the next Bitcoin halving. Outside this defined market phase the accumulation bands get increasingly inefficient as stronger impulses and crashes occur during bullmarket and bearmarket respectively, leading to frequent breaches of those bands. For bull- and bearmarkets the classic Confidence Bands should be used.The image below shows the three hitherto existing accumulation phases for Bitcoin marked with blue semi-transparent boxes, and the corresponding price touches of the yellow and cyan Accumulation Bands. Note that in the third accumulation phase the March 2020 black swan liquidity crisis happened, which led to a breach of the lower Accumulation Band down to the lower Confidence Band.
https://www.tradingview.com/x/PZPFtXIL/
Note that the Accumulation Bands are hidden from the chart by default when you apply the indicator to your chart, but can be activated in the Input Settings menu.
Also the Resolution parameter was added, which should always be kept on weekly time frame in the Input Settings menu. With this, the Confidence Bands can correctly be observed on the daily (and other) time frames.
Skrip jemputan sahaja
Akses ke skrip ini adalah terhad kepada pengguna yang diberikan akses oleh penulis dan kebiasaannya memerlukan pembayaran. Anda boleh menambahkannya kepada senarai kegemaran anda, tetapi anda hanya dapat menggunakannya setelah meminta izin dan mendapatkannya dari penulis. Sila hubungi Dean_Trader untuk lebih maklumat atau rujuk arahan penulis seperti di bawah.
TradingView tidak mencadangkan anda membayar untuk skrip dan menggunakannya kecuali anda mempercayai penulisnya 100% dan memahami bagaimana skrip itu berfungsi. Juga, anda boleh mencari alternatif sumber terbuka yang bagus secara percuma dalam Skrip Komuniti kami.
Arahan penulis
″All Bitcoin trades based on this indicator are also discussed within DeanTrader's private groups. To gain access to those you have to purchase the full DeanTrader Swing Algo V1 Series package. Please contact me via DM on TradingView for this.
Ingin menggunakan skrip ini pada carta?
Amaran: sila baca sebelum memohon akses.
Website (for access to my scripts): deantrader.com
Twitter (for Swing Algo footage): twitter.com/Dean_Trader
Twitter (for Swing Algo footage): twitter.com/Dean_Trader
Penafian
Maklumat dan penerbitan adalah tidak dimaksudkan untuk menjadi, dan tidak membentuk, nasihat untuk kewangan, pelaburan, perdagangan dan jenis-jenis lain atau cadangan yang dibekalkan atau disahkan oleh TradingView. Baca dengan lebih lanjut di Terma Penggunaan.