PROTECTED SOURCE SCRIPT
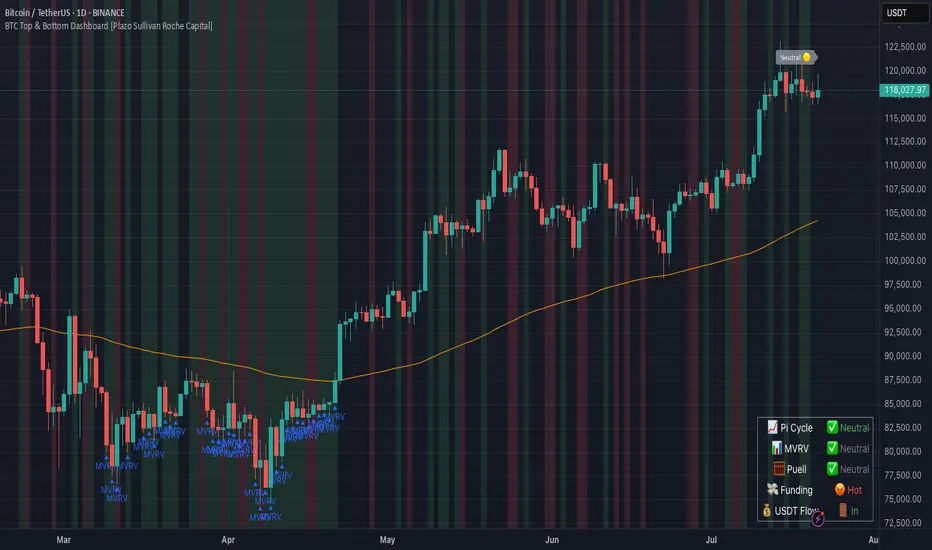
BTC Top & Bottom Dashboard [Plazo Sullivan Roche Capital]
Bitcoin Top & Bottom Master Overlay Indicator Manual
Overview
The BTC Top & Bottom Master Overlay is an all-in-one TradingView indicator designed for professional traders seeking high-probability macro turning points on Bitcoin. It combines multiple proven on-chain proxies, smart money concepts, and funding/stablecoin flow data into one cohesive visual dashboard.
It is optimized for:
Daily timeframe (1D)
Binance:BTCUSDT chart (can adapt to others)
Swing and macro-level analysis
Features at a Glance
Macro Top Indicators
Pi Cycle Top: Cross of EMA111 over 2x SMA350
MVRV Z-Score Proxy: Z-score > 7 suggests overheating
Puell Multiple Proxy: Price/365-day MA > 4 signals miner overprofit
Funding Rate Spike: Funding > 0.006 suggests long bias extremes
Stablecoin Outflow: Proxy from USDT Dominance rising (risk-off sentiment)
Macro Bottom Indicators
MVRV Z-Score < 0: Capitulation signal
Puell < 0.4: Miner surrender
Funding < -0.006: Excessive shorting = squeeze risk
Stablecoin Inflow: USDT.D falling = crypto accumulation
Smart Money Concepts
Fair Value Gaps (FVG):
Bullish: Green zone when low[1] > high[2]
Bearish: Red zone when high[1] < low[2]
Order Blocks:
Bullish OB: Bullish engulfing candle
Bearish OB: Bearish engulfing candle
Visual Aids & Dashboard
Background shading:
Red when 2+ top signals flash
Green when 2+ bottom signals flash
Floating Score Label:
Top-right label: "Top Risk" / "Accumulation" / "Neutral"
Live score count out of 5
Signal Table Panel:
Bottom-right emoji panel showing:
Pi Cycle: 🔴 or ✅
MVRV: ⬆️ / ⬇️ / Neutral
Puell: ⬆️ / ⬇️ / Neutral
Funding: 😡 / 🟢 / Neutral
USDT Flow: 🚪 Out / 🚪 In / Neutral
How to Use
1. Chart Setup
Use 1D timeframe for macro trends.
Apply on Binance:BTCUSDT for full compatibility.
Toggle inputs like FVG, OB, or Table Panel to customize view.
2. Entry & Exit Scenarios
Top Risk Setup:
Background turns red
Top Score ≥ 3/5
Signal panel shows: Pi Cycle = ON, MVRV = HOT, Funding = HOT
FVG or OB above current price = ideal exit zone
Bottom Opportunity Setup:
Background turns green
Bottom Score ≥ 3/5
Signal panel shows: Puell = LOW, MVRV = LOW, Stablecoins = Inflow
Bullish FVG or OB nearby = ideal accumulation zone
3. Alerts
Create alerts for:
BTC TOP Signal: 3+ Indicators aligned!
BTC BOTTOM Signal: 3+ Indicators aligned!
Pro Tips
Use in conjunction with volume profile and macro trendlines
Confirm tops with altcoin euphoria (e.g. dominance drop)
Confirm bottoms with volume spikes and stablecoin inflows
Backtest logic using replay + score panel
Use OB/FVG zones for high-RR trades
⚡ Troubleshooting
Error: Invalid Symbol CRYPTOCAP:TOTALUSDT
✉ Fix: Replace with CRYPTOCAP:USDT.D (USDT dominance proxy)
Lag on older devices
✉ Tip: Turn off FVG or OB drawing for performance
📅 Future Upgrades (Planned)
Multi-asset compatibility (ETH, SOL, etc.)
Cross-timeframe alerts
AI-generated trade callouts
Strategy tester version for backtesting
✅ Summary
This indicator acts as your macro market compass. It brings together advanced institutional-style analysis and visual storytelling into a seamless TradingView overlay. Whether you're swing trading or analyzing macro cycles, this tool gives you the edge.
🚀 Trade smarter. Enter with confidence. Exit with clarity.
Ask ChatGPT
Skrip dilindungi
Skrip ini diterbitkan sebagai sumber tertutup. Akan tetapi, anda boleh menggunakannya dengan percuma dan tanpa had – ketahui lebih lanjut di sini.
Penafian
Maklumat dan penerbitan adalah tidak dimaksudkan untuk menjadi, dan tidak membentuk, nasihat untuk kewangan, pelaburan, perdagangan dan jenis-jenis lain atau cadangan yang dibekalkan atau disahkan oleh TradingView. Baca dengan lebih lanjut di Terma Penggunaan.