OPEN-SOURCE SCRIPT
Telah dikemas kini Real-Time Open Levels with Labels + Info Table
Real-Time Multi-Timeframe Open Levels with Labels & Info Panel
Overview
This indicator displays real-time opening price levels across multiple timeframes (Monthly, Weekly, Daily, 4H) directly on your chart. It features:
• Dynamic horizontal lines extending through each timeframe period
• Customizable labels with text/colors
• Special 4H line treatment for the last hour (5-min charts only)
• Integrated information panel showing symbol, timeframe, and price changes

*Example showing multiple timeframe levels with labels and info panel*
---
Features & Configuration
1. Monthly Settings

Show Monthly: Toggle visibility of monthly opening price
Color: Semi-transparent blue (#2196F3 at 70% opacity)
Width: 2px line thickness
Style: Solid/Dotted/Dashed
Label: Display "M-Open" text with white text on blue background
2. Weekly Settings

Show Weekly: Toggle weekly opening price visibility
Color: Semi-transparent red (#FF5252 at 70% opacity)
Width: 1px thickness
Style: Dotted by default
Label: "W-Open" text in white on red background
3. Daily Settings

Show Daily: Toggle daily opening price
Color: Amber (#FFA000 at 70% opacity)
Width: 2px thickness
Style: Solid
Label: "D-Open" in white on orange background
---
4. 4-Hour Settings (5-Minute Charts Only)
Special Features for 5-Min Timeframe:
1. Standard 4H Line
• First 3 hours: Green (#4CAF50) dashed line
• Last hour: Bright red solid line (configurable)
• Vertical divider between 3rd/4th hours
2. Configuration Options
• Main 4H Line:
◦ Color/Width/Style for initial 3 hours
◦ Toggle label ("H4-Open") visibility and styling
• Final Hour Enhancement:
*Last Hour Line*
◦ Unique red color and line style
◦ Separate width (1px) and style (Solid)
*Divider Line*
◦ Vertical red dotted line marking last hour
◦ Adjustable position/width/transparency

*4H levels showing 3-hour segment and final hour treatment*
---
5. Info Panel Settings
Positioning:
• Anchor to any chart corner (Top/Bottom + Left/Right combinations)
• Three text sizes: Title (Huge), Change % (Large), Signature (Small)
Display Elements:
• Symbol: Show exchange prefix (e.g., "NASDAQ:")
• Timeframe: Current chart period (e.g., "5m")
• Change %: 24-hour price movement ▲/▼ percentage
• Custom Signature: Add text/username in footer
Styling:
• Semi-transparent white text (#ffffff77)
• Currency pair formatting (e.g., BTC/USD vs BTC-USD)

*Sample info panel with all elements enabled*
---
Usage Tips
1. Multi-Timeframe Context: Use levels to identify key daily/weekly support/resistance
2. 4H Trading: On 5-min charts, watch for price reactions near final hour transition
3. Customization:
• Match line colors to your chart theme
• Use different labels for clarity (e.g., "Weekly Open")
• Disable unused elements to reduce clutter
4. Divider Lines: Helps identify institutional trading periods (hour closes)
---
*Created using Pine Script v6. For optimal performance, use on charts <1H timeframe. [Get this script on TradingView]()*
[Documentation version 1.0 - Updated 2024-03-15]
Nota Keluaran
English User Manual Update - ADR Feature Enhancement ---
**Version Update Summary**
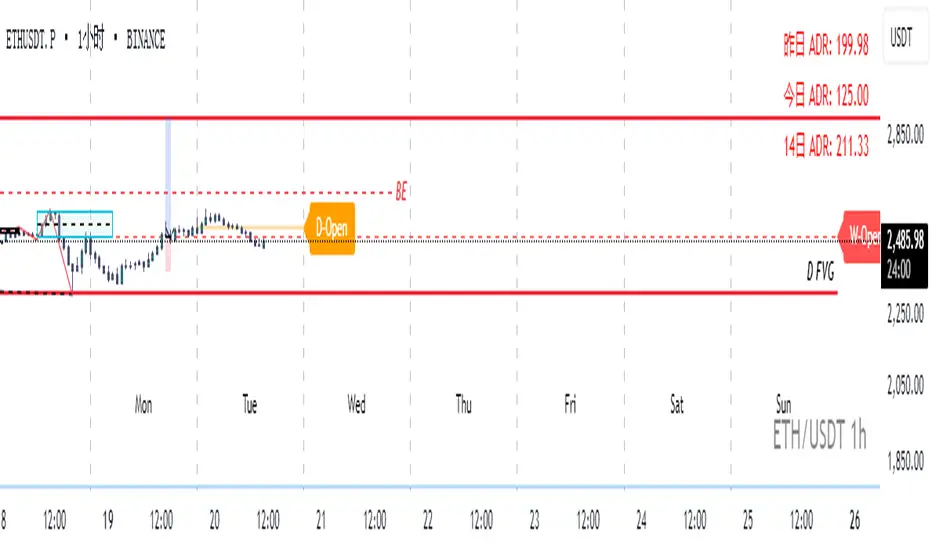
This update introduces the ADR (Average Daily Range) feature, providing dynamic volatility analysis with customizable display options. The indicator now supports multi-timeframe open price levels with enhanced visual controls and an integrated ADR information panel.
---
**New Features: ADR Settings**
**6. ADR Parameters**

*Access via indicator settings > "6. ADR Parameters"*
1. Show ADR Info
• Toggle visibility of the ADR panel.
• *Default: Enabled*
2. Calculation Period
• Set the lookback period (in days) for the average ADR calculation.
• *Range: 1–100 days | Default: 25*
3. Display Options
• Show Yesterday's ADR: Displays the previous day's price range.
• Show Today's ADR: Shows the current day's intraday range.
• Show Average ADR: Displays the smoothed ADR over the selected period.
• *All options enabled by default.*
4. Decimal Precision
• Adjust the number of decimals for ADR values.
• *Range: 0–6 | Default: 2*
---
**7. ADR Table Positioning**

*Access via indicator settings > "7. ADR Table Location"*
1. Vertical Position
• Choose `top`, `middle`, or `bottom` placement on the chart.
2. Horizontal Position
• Align to `left`, `center`, or `right`.
3. Text Customization
• Text Size: Options from `tiny` to `huge` (default: `small`).
• Text Color: Select any color (default: white).
---
**Example Use Cases**
1. Volatility Analysis:
• Compare today’s range (Today ADR) against the historical average (25-day ADR) to gauge market volatility.
2. Session Planning:
• Use the "Yesterday ADR" to identify potential support/resistance zones from the prior trading session.
3. Custom Alerts:
• Combine ADR data with price levels (e.g., daily opens) to set alerts for breakouts or reversals.
---
**Frequently Asked Questions (FAQ)**
Q1: Why does the ADR table not appear?
• Ensure `Show ADR Info` is enabled in settings (Section 6).
• Verify the chart’s timeframe is not monthly/weekly (ADR uses daily data).
Q2: How to reset ADR parameters?
• Right-click the indicator > *Settings* > Click `Restore Defaults`.
Q3: Can I change the ADR calculation period intraday?
• Yes—the `Calculation Period` updates dynamically.
---
**Compatibility Notes**
• Works on all assets with daily data (stocks, forex, crypto).
• Optimized for use with the existing multi-timeframe open levels (daily, weekly, monthly).
---
*Updated: 2024-03-05 | Version: 6.1 | By: [Your Name]*
For support, contact: [your.email@domain.com]
---
📌 Tip: Combine ADR levels with the 4H open lines (Section 4) for intraday trading strategies!
Nota Keluaran
📣 New Feature Alert: Daily Division Lines + Weekday Labels! 🎉 Let’s break down this fun & functional update with a *sandwich-style* explanation (good news ➡ details ➡ encouragement)!
---
**🥪 Top Layer: POSITIVE HIGHLIGHTS 🚀**
"YAAAS! Time to visualize weeks like a pro!" 👏
• NEW! Crisp vertical lines split each week into Monday → Sunday segments! 📅
• CUTE labels (Mon, Tue, Wed…) at the chart’s bottom make timing crystal clear! 🏷️
• Perfect for spotting daily patterns or aligning trades with specific sessions (London/NY/Asia)! 🌍
---
**🥪 Middle Layer: KEY DETAILS & CUSTOMIZATION 🛠️**
✨ Features:
• Full-chart coverage: Lines stretch from top to bottom! 📈➡📉
• Styling freedom: Choose colors, widths, and dashed/dotted styles! 🎨
• Smart positioning: Labels auto-adjust to weekly lows + user-defined offsets! ⚙️
🔧 Customize in settings:
• Toggle lines/labels ON/OFF 🕹️
• Pick colors (with transparency!) 🌈
• Adjust label position with the “Label Bottom Offset” slider! 📏
---
**🥪 Bottom Layer: CHEERFUL CLOSING 🌟**
"Go forth and conquer those weekly charts!" 💪
• Pro Tip: Use these lines to spot overnight gaps or news-driven moves! 📰
• Got ideas? We’re all ears! 😊 (Slap a comment below or tweak the code!)
Happy trading! 🚀📊
*(P.S. Mondays just got a little less scary… right? 😉)*
---
🔍 Quick Demo: Imagine analyzing a bullish breakout on Wednesday—now you’ll instantly see if it aligns with the London session open! 🕒🐂
Skrip sumber terbuka
Dalam semangat TradingView sebenar, pencipta skrip ini telah menjadikannya sumber terbuka, jadi pedagang boleh menilai dan mengesahkan kefungsiannya. Terima kasih kepada penulis! Walaupuan anda boleh menggunakan secara percuma, ingat bahawa penerbitan semula kod ini tertakluk kepada Peraturan Dalaman.
Penafian
Maklumat dan penerbitan adalah tidak bertujuan, dan tidak membentuk, nasihat atau cadangan kewangan, pelaburan, dagangan atau jenis lain yang diberikan atau disahkan oleh TradingView. Baca lebih dalam Terma Penggunaan.