OPEN-SOURCE SCRIPT
Vector Candles
Title: Vector Candles Indicator with PVSRA
Short Description: Visualize climax and above-average volume candles using PVSRA method for trend reversals and significant moves.
Long Description:
The Vector Candles Indicator with PVSRA (Price, Volume, Support, and Resistance Analysis) is designed to help traders visualize climax and above-average volume candles on the chart, which can indicate potential trend reversals and significant market moves. This indicator is suitable for various financial instruments, including stocks, forex, and cryptocurrencies.
This script uses the PVSRA method to determine the candle colour based on volume and price action. By analysing the relationships between price, volume, and support/resistance levels, it allows traders to better understand the market dynamics and make informed decisions.
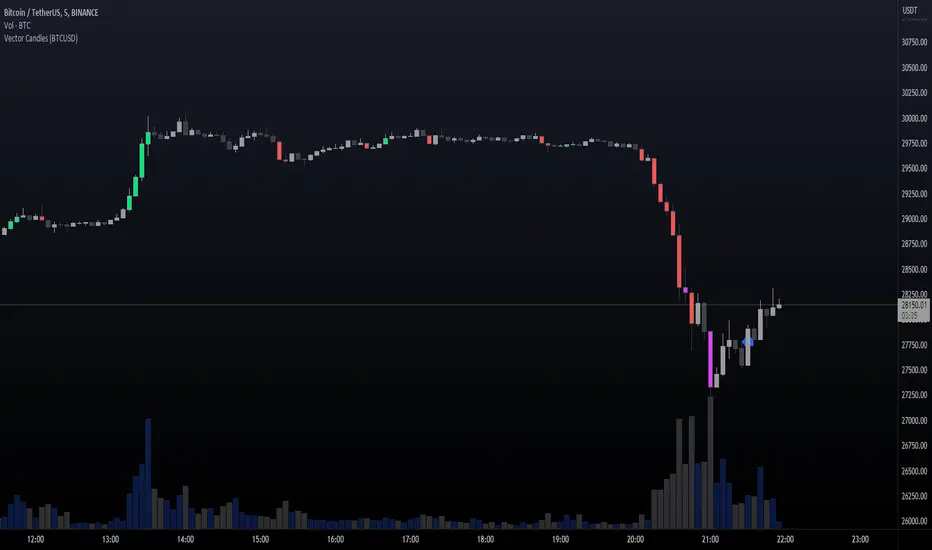
The indicator displays candles in different colours to represent the volume and price action:
Climax Up (Lime): Bullish candle with high volume
Climax Down (Red): Bearish candle with high volume
Above Average Up (Blue): Bullish candle with above-average volume
Above Average Down (Fuchsia): Bearish candle with above-average volume
Normal Up (Gray): Bullish candle with normal volume
Normal Down (Dark Gray): Bearish candle with normal volume
The script is designed to work on the TradingView platform and is based on original contributions by plasmapug, infernix, peshocore, and xtech5192. It has been modified RapidFireOG for easy integration into your trading setup.
Add this powerful tool to your chart and enhance your trading analysis with the Vector Candles Indicator with PVSRA.
Short Description: Visualize climax and above-average volume candles using PVSRA method for trend reversals and significant moves.
Long Description:
The Vector Candles Indicator with PVSRA (Price, Volume, Support, and Resistance Analysis) is designed to help traders visualize climax and above-average volume candles on the chart, which can indicate potential trend reversals and significant market moves. This indicator is suitable for various financial instruments, including stocks, forex, and cryptocurrencies.
This script uses the PVSRA method to determine the candle colour based on volume and price action. By analysing the relationships between price, volume, and support/resistance levels, it allows traders to better understand the market dynamics and make informed decisions.
The indicator displays candles in different colours to represent the volume and price action:
Climax Up (Lime): Bullish candle with high volume
Climax Down (Red): Bearish candle with high volume
Above Average Up (Blue): Bullish candle with above-average volume
Above Average Down (Fuchsia): Bearish candle with above-average volume
Normal Up (Gray): Bullish candle with normal volume
Normal Down (Dark Gray): Bearish candle with normal volume
The script is designed to work on the TradingView platform and is based on original contributions by plasmapug, infernix, peshocore, and xtech5192. It has been modified RapidFireOG for easy integration into your trading setup.
Add this powerful tool to your chart and enhance your trading analysis with the Vector Candles Indicator with PVSRA.
Skrip sumber terbuka
Dalam semangat TradingView sebenar, pencipta skrip ini telah menjadikannya sumber terbuka, jadi pedagang boleh menilai dan mengesahkan kefungsiannya. Terima kasih kepada penulis! Walaupuan anda boleh menggunakan secara percuma, ingat bahawa penerbitan semula kod ini tertakluk kepada Peraturan Dalaman.
Penafian
Maklumat dan penerbitan adalah tidak bertujuan, dan tidak membentuk, nasihat atau cadangan kewangan, pelaburan, dagangan atau jenis lain yang diberikan atau disahkan oleh TradingView. Baca lebih dalam Terma Penggunaan.