OPEN-SOURCE SCRIPT
Telah dikemas kini X OC Story
Overview
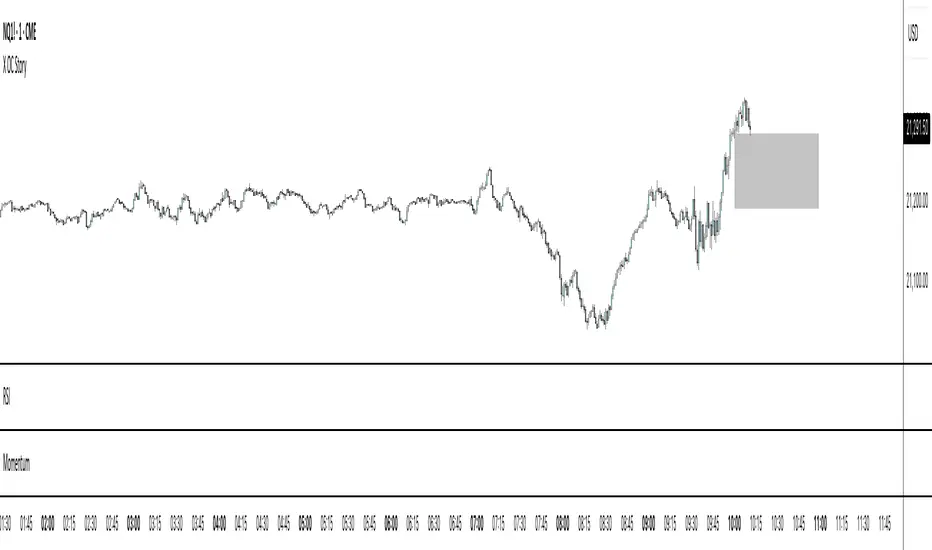
The "X OC Story" is a Pine Script indicator that visualizes the Open-Close range of a higher timeframe (HTF) candle on a lower timeframe chart. By plotting dynamic lines to represent the open and close prices of the previous HTF bar, this tool gives traders a clearer context of recent market sentiment and structural shifts. It includes color-coded visual fills to distinguish between bullish and bearish candles and offers the option to display only the most recent range.
Concept
1. Multi-Timeframe Analysis (MTF)
At its core, this indicator utilizes multi-timeframe analysis by requesting open, high, low, and close values from a user-defined HTF (input.timeframe('60')) and applying them to a lower timeframe chart. This allows traders to incorporate higher timeframe information without switching chart intervals.
2. Timeframe Change Detection
The indicator detects when a new HTF candle begins which lets the script know when to capture and visualize a new set of HTF open-close values.
3. Encapsulation with Custom Type (candles)
The script defines a custom type candles to encapsulate OHLC values of the previous HTF candle. This improves code readability and structure by keeping all relevant HTF data in a single object.
4. Dynamic Line Drawing
When a new HTF candle is detected, two horizontal lines are drawn for Open and Close. These are updated dynamically on each bar to extend across the entire HTF candle range on the lower timeframe chart.
5. Visual Highlighting
a shaded area is drawn between the open and close lines which help highlight market structure without overwhelming the chart.
6. Selective Persistence of Drawings
Users can enable deleteOld to show only the most recent HTF open-close range. When enabled, previously drawn lines are tracked in an array and deleted upon creation of a new range, keeping the chart clean and focused.
How a Trader Might Use This Tool
Contextual Decision-Making
This indicator helps traders see where the market is trading relative to the previous HTF candle:
Trading above the HTF close may suggest bullish continuation
Trading below the HTF open may indicate a bearish reversal or breakdown
Confluence Zones
The open and close lines of HTF candles often act as support/resistance levels. A trader might:
Watch for rejections or breakouts at these levels
Use them in confluence with intraday setups or trend indicators
Scalping or Intraday Strategy Support
Since this visual is drawn on a lower timeframe (like 5m or 15m), it’s particularly useful for scalpers or day traders who want to factor in HTF sentiment without leaving their active chart.
Cleaner Charting
With the optional setting to display only the most recent range (deleteOld), traders avoid clutter and focus on the current actionable zone.
Summary
“X OC Story” is a clean, visual, and effective multi-timeframe utility that helps traders:
Identify HTF open-close context
Highlight possible support/resistance zones
Analyze sentiment and structure visually
It’s an excellent addition to any discretionary trader’s toolkit for improved context awareness and informed entries or exits.
Nota Keluaran
two HTF setting available nowNota Keluaran
clean up Skrip sumber terbuka
Dalam semangat TradingView sebenar, pencipta skrip ini telah menjadikannya sumber terbuka, jadi pedagang boleh menilai dan mengesahkan kefungsiannya. Terima kasih kepada penulis! Walaupuan anda boleh menggunakan secara percuma, ingat bahawa penerbitan semula kod ini tertakluk kepada Peraturan Dalaman.
Penafian
Maklumat dan penerbitan adalah tidak bertujuan, dan tidak membentuk, nasihat atau cadangan kewangan, pelaburan, dagangan atau jenis lain yang diberikan atau disahkan oleh TradingView. Baca lebih dalam Terma Penggunaan.
Skrip sumber terbuka
Dalam semangat TradingView sebenar, pencipta skrip ini telah menjadikannya sumber terbuka, jadi pedagang boleh menilai dan mengesahkan kefungsiannya. Terima kasih kepada penulis! Walaupuan anda boleh menggunakan secara percuma, ingat bahawa penerbitan semula kod ini tertakluk kepada Peraturan Dalaman.
Penafian
Maklumat dan penerbitan adalah tidak bertujuan, dan tidak membentuk, nasihat atau cadangan kewangan, pelaburan, dagangan atau jenis lain yang diberikan atau disahkan oleh TradingView. Baca lebih dalam Terma Penggunaan.