Telah dikemas kini
Probability Oscillator (Zeiierman)
█ Overview
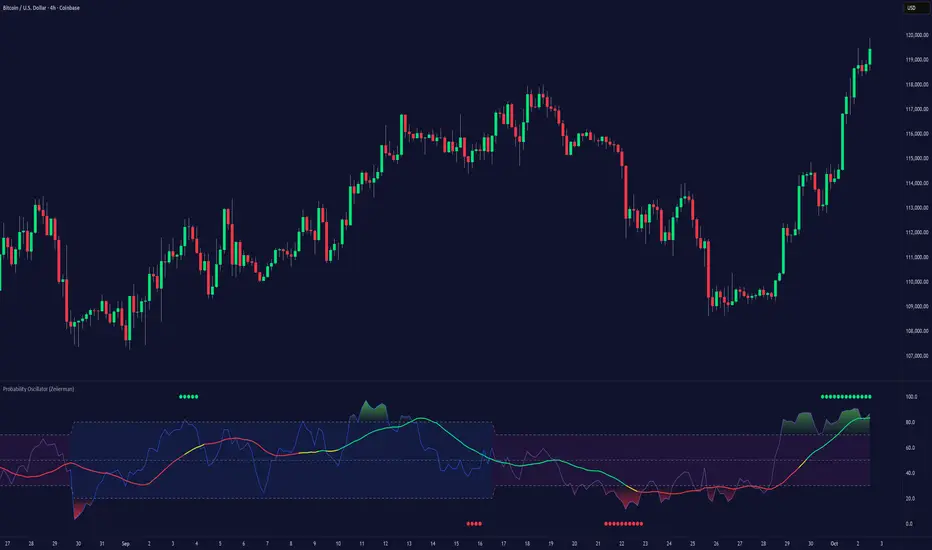
The Probability Oscillator (Zeiierman) turns price dynamics into a regime-aware probability map of continuation vs. reversal. Rather than treating momentum as a single, fixed signal, it adapts its core estimator to current market conditions—favoring trend persistence in calm regimes and oscillation/reversion in volatile regimes.
You get a fast Probability line, a slower Signal line, dynamic OB/OS bounds, midline bias, color-coded trend probability, background regime cues, and Momentum Impulse dots that reveal concentrated bursts of directional intent. Beneath the surface, the Probability line functions as a sequential Bayesian filter — continuously updating a regime-conditioned prior (trend or volatility) with new market evidence. The resulting posterior odds are then expressed as a bounded oscillator for intuitive interpretation. In stable markets, the prior favors continuity; in volatile markets, it reweights toward mean reversion.

⚪ Why This One Is Unique
The Probability Oscillator operates within a self-adaptive probabilistic framework that continuously reshapes itself in response to the market’s evolving structure. Rather than relying on fixed formulas or static thresholds, it employs a context-aware Bayesian core that interprets flow dynamics through an adaptive regime model.
Its internal architecture blends state recognition, probability normalization, and dynamic envelope mapping, allowing it to adjust between conditions of directional stability and volatility-driven reversion fluidly. The result is an intelligent, self-adjusting probability field that remains stable in trends, reactive in consolidations, and contextually aware across all market states—delivering a refined sense of probabilistic direction without exposing raw computational structure.
█ Main Features
⚪ Probability Oscillator
At the core lies a probability-driven oscillator that continuously adapts its internal weighting to evolving market behavior. It translates incoming price evidence into a smooth probability curve that distinguishes between continuation and reversion phases, providing a refined view of conviction beneath price action.
The Probability Oscillator estimates the likelihood of trend continuation while dynamically adjusting to the surrounding volatility regime:
The oscillator’s probabilistic framework automatically transitions between two self-adaptive modes:
This dual-regime behavior allows the Probability Oscillator to remain stable in directional trends yet responsive in volatile ranges, producing a coherent probabilistic signal across any timeframe.

⚪ Trend Probability Coloring
The Trend Probability Coloring system transforms the Signal Line into a live confidence gauge. Its adaptive hue reflects the underlying probabilistic bias — green for sustained bullish pressure, red for bearish control, and yellow during transitional uncertainty. Behind the scenes, it applies curvature-sensitive weighting and probabilistic smoothing to display a visually coherent measure of directional conviction.

⚪ Impulse Dots
Impulse Dots identify moments of concentrated momentum expansion — short bursts of probabilistic acceleration that often precede shifts in structure. Each impulse represents a localized jump in directional confidence, isolating meaningful change-points from background noise. The result is a precise visualization of where probability and price begin to align, revealing early cues of strength, exhaustion, or imminent rotation.

█ How to Use
⚪ Trend Following
The Signal Line acts as the long-term probabilistic trend gauge, revealing when the market is building or losing directional conviction. Its slope and color communicate both bias and transition strength:
Use the Signal Line to confirm directional alignment:
A transition from red → yellow → green signals that the market is turning bullish and probability is shifting toward continuation on the upside.

A transition from green → yellow → red signals that bullish conviction is fading and bearish control is emerging.

⚪ Overbought & Oversold
The Probability Oscillator can also be used to identify overbought and oversold conditions by observing when the Probability Line moves above its upper bound or below its lower bound. These events often signal potential market slowdowns, pullbacks, or even broader reversals depending on context and regime.
The OB/OS levels automatically adapt to the prevailing market mode:
Signals: Reclaims from oversold zones within a bullish bias, or rejections from overbought zones in a bearish bias, represent high-probability inflection points — especially when confirmed by Impulse Dots or regime-aligned Signal Line color transitions.

⚪ Using Volatility Modes to Choose Strategy
The Probability Oscillator automatically adapts its behavior to the active volatility regime, enabling traders to align their approach with the current market state. One of the most effective ways to use the tool is to select a trading strategy that aligns with the prevailing market mode.
Trend Mode (purple fill) – Represents low-volatility, directional environments where markets move smoothly and sustain momentum over time. In these conditions, a trend-following approach is most effective. Focus on the broader direction, participate on Probability-over-Signal crossups above 50, and trail positions as long as the Signal Line remains green. These calm phases often persist before volatility expansion, making them ideal for riding steady continuation waves rather than reacting to short-term fluctuations.

Volatility Mode (blue switch bar) – Activates in high-volatility conditions, signaling increased market agitation and sharper price swings. In this regime, trading becomes more tactical. Mean-reversion and scalping strategies perform best—fade OB/OS extremes, use midline reclaims for timing, or trade Impulse confirmations to capture breakout accelerations and short-term momentum surges.

⚪ Impulse
The Momentum Impulses highlight periods when the market experiences sharp bursts of directional momentum, marking transitions in conviction strength and energy expansion.
These impulses are particularly useful in two contexts:
In essence, Impulse Dots visualize the heartbeat of market conviction—pinpointing where momentum surges align with probabilistic bias, whether to confirm a breakout or warn of exhaustion in choppy conditions.

█ How It Works
⚪ Regime Switch Engine
At the foundation lies a Bayesian regime adaptation process that treats volatility as evolving market evidence. The system continuously updates a prior belief about whether the market favors directional persistence or oscillatory reversion. In calm states, it maintains a continuity-biased belief structure that favors smoother probability propagation.
⚪ Trend Probability Coloring (Conviction Layer)
The Trend Probability Coloring system visualizes Bayesian posterior confidence in real time. It continuously updates the Signal Line’s color as new evidence shifts the model’s belief between bullish, neutral, and bearish states.
When the posterior probability leans strongly upward, the line turns green; as uncertainty grows, it fades to yellow; and when conviction turns negative, it transitions to red. Each color change represents a probabilistic reweighting — the model’s evolving assessment of directional dominance.
⚪ Momentum Impulse Engine
The Momentum Impulse Engine detects sudden bursts in probabilistic conviction — moments when the Bayesian posterior sharply reweights toward one directional outcome. These impulses represent statistically significant shifts in belief, where new evidence rapidly alters the model’s assessment of market direction.
Green impulses highlight surges in bullish probability; red impulses mark spikes in bearish conviction. Each impulse reflects a brief phase of directional dominance, revealing where probability momentum begins to accelerate or exhaust.
-----------------
Disclaimer
The content provided in my scripts, indicators, ideas, algorithms, and systems is for educational and informational purposes only. It does not constitute financial advice, investment recommendations, or a solicitation to buy or sell any financial instruments. I will not accept liability for any loss or damage, including without limitation any loss of profit, which may arise directly or indirectly from the use of or reliance on such information.
All investments involve risk, and the past performance of a security, industry, sector, market, financial product, trading strategy, backtest, or individual's trading does not guarantee future results or returns. Investors are fully responsible for any investment decisions they make. Such decisions should be based solely on an evaluation of their financial circumstances, investment objectives, risk tolerance, and liquidity needs.
The Probability Oscillator (Zeiierman) turns price dynamics into a regime-aware probability map of continuation vs. reversal. Rather than treating momentum as a single, fixed signal, it adapts its core estimator to current market conditions—favoring trend persistence in calm regimes and oscillation/reversion in volatile regimes.
You get a fast Probability line, a slower Signal line, dynamic OB/OS bounds, midline bias, color-coded trend probability, background regime cues, and Momentum Impulse dots that reveal concentrated bursts of directional intent. Beneath the surface, the Probability line functions as a sequential Bayesian filter — continuously updating a regime-conditioned prior (trend or volatility) with new market evidence. The resulting posterior odds are then expressed as a bounded oscillator for intuitive interpretation. In stable markets, the prior favors continuity; in volatile markets, it reweights toward mean reversion.
⚪ Why This One Is Unique
The Probability Oscillator operates within a self-adaptive probabilistic framework that continuously reshapes itself in response to the market’s evolving structure. Rather than relying on fixed formulas or static thresholds, it employs a context-aware Bayesian core that interprets flow dynamics through an adaptive regime model.
Its internal architecture blends state recognition, probability normalization, and dynamic envelope mapping, allowing it to adjust between conditions of directional stability and volatility-driven reversion fluidly. The result is an intelligent, self-adjusting probability field that remains stable in trends, reactive in consolidations, and contextually aware across all market states—delivering a refined sense of probabilistic direction without exposing raw computational structure.
█ Main Features
⚪ Probability Oscillator
At the core lies a probability-driven oscillator that continuously adapts its internal weighting to evolving market behavior. It translates incoming price evidence into a smooth probability curve that distinguishes between continuation and reversion phases, providing a refined view of conviction beneath price action.
The Probability Oscillator estimates the likelihood of trend continuation while dynamically adjusting to the surrounding volatility regime:
- Probability Line (fast) – Captures short-term probability shifts, weighted by current market conditions — calm or volatile.
- Signal Line (slow) – A smoothed probability filter that defines the prevailing bias and confirms directional persistence.
- Momentum Impulse Dots – Small markers highlighting bursts of positive (green) or negative (red) momentum, indicating transitions in conviction strength.
The oscillator’s probabilistic framework automatically transitions between two self-adaptive modes:
- Low-Volatility Mode – Prioritizes directional momentum and smooth trend continuity, ideal for trending markets.
- High-Volatility Mode – Emphasizes oscillatory probability swings and reversals, optimized for range-bound or transitional conditions.
This dual-regime behavior allows the Probability Oscillator to remain stable in directional trends yet responsive in volatile ranges, producing a coherent probabilistic signal across any timeframe.
⚪ Trend Probability Coloring
The Trend Probability Coloring system transforms the Signal Line into a live confidence gauge. Its adaptive hue reflects the underlying probabilistic bias — green for sustained bullish pressure, red for bearish control, and yellow during transitional uncertainty. Behind the scenes, it applies curvature-sensitive weighting and probabilistic smoothing to display a visually coherent measure of directional conviction.
⚪ Impulse Dots
Impulse Dots identify moments of concentrated momentum expansion — short bursts of probabilistic acceleration that often precede shifts in structure. Each impulse represents a localized jump in directional confidence, isolating meaningful change-points from background noise. The result is a precise visualization of where probability and price begin to align, revealing early cues of strength, exhaustion, or imminent rotation.
█ How to Use
⚪ Trend Following
The Signal Line acts as the long-term probabilistic trend gauge, revealing when the market is building or losing directional conviction. Its slope and color communicate both bias and transition strength:
- Green → bullish probability bias (trend continuation likely).
- Red → bearish probability bias (downside continuation likely).
- Yellow → transitional or indecisive phase (potential regime shift).
Use the Signal Line to confirm directional alignment:
A transition from red → yellow → green signals that the market is turning bullish and probability is shifting toward continuation on the upside.
A transition from green → yellow → red signals that bullish conviction is fading and bearish control is emerging.
⚪ Overbought & Oversold
The Probability Oscillator can also be used to identify overbought and oversold conditions by observing when the Probability Line moves above its upper bound or below its lower bound. These events often signal potential market slowdowns, pullbacks, or even broader reversals depending on context and regime.
The OB/OS levels automatically adapt to the prevailing market mode:
- Trend Mode (~70/30) – Optimized for riding trends and timing pullbacks within directional continuations.
- Volatility Mode (~80/20) – Tailored for fading extremes and capturing fast mean-reversion moves during consolidation phases.
Signals: Reclaims from oversold zones within a bullish bias, or rejections from overbought zones in a bearish bias, represent high-probability inflection points — especially when confirmed by Impulse Dots or regime-aligned Signal Line color transitions.
⚪ Using Volatility Modes to Choose Strategy
The Probability Oscillator automatically adapts its behavior to the active volatility regime, enabling traders to align their approach with the current market state. One of the most effective ways to use the tool is to select a trading strategy that aligns with the prevailing market mode.
Trend Mode (purple fill) – Represents low-volatility, directional environments where markets move smoothly and sustain momentum over time. In these conditions, a trend-following approach is most effective. Focus on the broader direction, participate on Probability-over-Signal crossups above 50, and trail positions as long as the Signal Line remains green. These calm phases often persist before volatility expansion, making them ideal for riding steady continuation waves rather than reacting to short-term fluctuations.
Volatility Mode (blue switch bar) – Activates in high-volatility conditions, signaling increased market agitation and sharper price swings. In this regime, trading becomes more tactical. Mean-reversion and scalping strategies perform best—fade OB/OS extremes, use midline reclaims for timing, or trade Impulse confirmations to capture breakout accelerations and short-term momentum surges.
⚪ Impulse
The Momentum Impulses highlight periods when the market experiences sharp bursts of directional momentum, marking transitions in conviction strength and energy expansion.
- Green top dots → Indicate strong bullish impulses, often signaling the onset or acceleration of upward momentum.
- Red bottom dots → Indicate strong bearish impulses, highlighting pressure buildup or downside continuation.
These impulses are particularly useful in two contexts:
- During ranging markets, they help confirm overbought and oversold conditions, signaling when reversals or exhaustion points are highly probable.
- During regime transitions, they validate breakout strength, confirming that new directional phases are supported by genuine momentum rather than noise.
In essence, Impulse Dots visualize the heartbeat of market conviction—pinpointing where momentum surges align with probabilistic bias, whether to confirm a breakout or warn of exhaustion in choppy conditions.
█ How It Works
⚪ Regime Switch Engine
At the foundation lies a Bayesian regime adaptation process that treats volatility as evolving market evidence. The system continuously updates a prior belief about whether the market favors directional persistence or oscillatory reversion. In calm states, it maintains a continuity-biased belief structure that favors smoother probability propagation.
- Calculation: Employs a volatility-normalized Bayesian comparator, generating a posterior distribution over regime likelihoods. This ensures the oscillator remains statistically invariant to scale and consistent across instruments and timeframes.
⚪ Trend Probability Coloring (Conviction Layer)
The Trend Probability Coloring system visualizes Bayesian posterior confidence in real time. It continuously updates the Signal Line’s color as new evidence shifts the model’s belief between bullish, neutral, and bearish states.
When the posterior probability leans strongly upward, the line turns green; as uncertainty grows, it fades to yellow; and when conviction turns negative, it transitions to red. Each color change represents a probabilistic reweighting — the model’s evolving assessment of directional dominance.
- Calculation: Applies posterior-weighted smoothing and curvature-based confidence mapping to translate Bayesian belief strength into a fluid visual gradient.
⚪ Momentum Impulse Engine
The Momentum Impulse Engine detects sudden bursts in probabilistic conviction — moments when the Bayesian posterior sharply reweights toward one directional outcome. These impulses represent statistically significant shifts in belief, where new evidence rapidly alters the model’s assessment of market direction.
Green impulses highlight surges in bullish probability; red impulses mark spikes in bearish conviction. Each impulse reflects a brief phase of directional dominance, revealing where probability momentum begins to accelerate or exhaust.
- Calculation: Employs nonlinear Bayesian change detection and extreme-value gating to isolate abrupt posterior inflections.
-----------------
Disclaimer
The content provided in my scripts, indicators, ideas, algorithms, and systems is for educational and informational purposes only. It does not constitute financial advice, investment recommendations, or a solicitation to buy or sell any financial instruments. I will not accept liability for any loss or damage, including without limitation any loss of profit, which may arise directly or indirectly from the use of or reliance on such information.
All investments involve risk, and the past performance of a security, industry, sector, market, financial product, trading strategy, backtest, or individual's trading does not guarantee future results or returns. Investors are fully responsible for any investment decisions they make. Such decisions should be based solely on an evaluation of their financial circumstances, investment objectives, risk tolerance, and liquidity needs.
Nota Keluaran
A completely new probability model that automatically adapts its behavior depending on the likelihood of trending or volatile conditions, giving traders a clearer view of when to apply trend-following strategies versus faster momentum or scalping approaches.Nota Keluaran
Signal line alerts have been addedTersedia dalam Ruangan Berbayar
Penunjuk ini hanya tersedia untuk pelanggan Zeiierman . Sertai untuk mengaksesnya dan skrip lain oleh Zeiierman.
Access my indicators at: zeiierman.com
Join Our Free Discord: discord.gg/zeiiermantrading
Join Our Free Discord: discord.gg/zeiiermantrading
Penafian
Maklumat dan penerbitan adalah tidak bertujuan, dan tidak membentuk, nasihat atau cadangan kewangan, pelaburan, dagangan atau jenis lain yang diberikan atau disahkan oleh TradingView. Baca lebih dalam Terma Penggunaan.
Tersedia dalam Ruangan Berbayar
Penunjuk ini hanya tersedia untuk pelanggan Zeiierman . Sertai untuk mengaksesnya dan skrip lain oleh Zeiierman.
Access my indicators at: zeiierman.com
Join Our Free Discord: discord.gg/zeiiermantrading
Join Our Free Discord: discord.gg/zeiiermantrading
Penafian
Maklumat dan penerbitan adalah tidak bertujuan, dan tidak membentuk, nasihat atau cadangan kewangan, pelaburan, dagangan atau jenis lain yang diberikan atau disahkan oleh TradingView. Baca lebih dalam Terma Penggunaan.