PROTECTED SOURCE SCRIPT
Telah dikemas kini Rapid HTF Price Action Dashboard V2.0
Rapid HTF Price Action Dashboard V2.0
Overview
Stop the constant switching between timeframes. The Rapid HTF Price Action Dashboard is an all-in-one analysis suite designed to give you a crystal-clear view of the market's true intent by projecting critical higher-timeframe (HTF) data directly onto your trading chart.
This tool is more than just a pattern indicator; it's a complete dashboard that provides institutional-grade insights into price action. It helps you anticipate market moves by showing you where liquidity lies and how the bigger players are positioning themselves, all from the comfort of your lower-timeframe chart.
Key Features
Multi-Timeframe Dashboard: A clean, intuitive panel on the right of your chart displays the last two closed higher-timeframe candles (Candle A & B) and the live, developing one (Candle C).
Projected HTF Levels: Automatically draws and projects the previous HTF candle's high and low across your chart, acting as critical dynamic support and resistance levels.
Advanced Pattern Recognition: Identifies seven high-conviction candlestick patterns based on our proprietary filtering system, designed to eliminate noise and pinpoint only the most potent signals.
The Logic: Why Our Signals Are More Accurate
This indicator goes far beyond textbook definitions. We don't just look for shapes; we look for the story behind the price action. Each pattern is filtered through a rigorous set of conditions to ensure it represents true market conviction.
Hammers & Inverted Hammers: The Liquidity Grab
Classic Hammer/IH patterns are often misleading. Ours are different. We identify them as true liquidity grab signals, a core concept used in ICT (Inner Circle Trader) methodologies.
A Hammer (H) is only valid if its low wick has pierced below the low of the previous candle (low < low[1]). This signifies a "stop hunt" where liquidity was absorbed below a key level before buyers aggressively pushed the price up.
An Inverted Hammer (IH) is only valid if its high wick has pierced above the high of the previous candle (high > high[1]). This shows liquidity was taken above a prior high before sellers took control and suppressed the price.
Harami: Filtering for Conviction
A classic Harami (an inside bar) can often just be a weak doji, signaling indecision. We filter this noise out.
Our Harami signal (BeH, BuH) requires the inside candle to have a meaningful body (defaulting to 30% of its own range, but fully customizable).
Furthermore, we have enhanced the logic to ensure the body of the inside candle is strictly contained within the body of the previous candle, making it a more precise and reliable signal of consolidation before a potential expansion.
Power Engulfing: A Signal of Overwhelming Force
We don't flag just any engulfing candle. We look for true displacement and momentum.
Our Power Engulfing pattern (BE, BuE) requires the body of the current candle to completely engulf the body of the previous candle.
Crucially, it must also close decisively beyond the entire range (including the wick) of the previous candle. A Bullish Engulfing must close above the previous high, and a Bearish Engulfing must close below the previous low. This confirms overwhelming force has entered the market and a reversal is highly probable.
How to Use the Dashboard
Set Your Reference Timeframe (refTF): Choose the higher timeframe you want to analyze (e.g., "240" for 4-Hour).
Identify the Narrative: Use the projected High/Low lines as your key support and resistance zones. A primary strategy is to wait for price to interact with these levels.
Anticipate the Draw on Liquidity: Watch as price approaches the previous HTF high or low. The dashboard helps you predict the market's next move. For example, if price is trading below the previous HTF low, you can anticipate a potential sweep of that level.
Confirm with a Signal: When a signal like a Hammer (H) appears on the dashboard after sweeping the previous low, it provides high-conviction confirmation that liquidity has been taken and price is ready to reverse.
Nota Keluaran
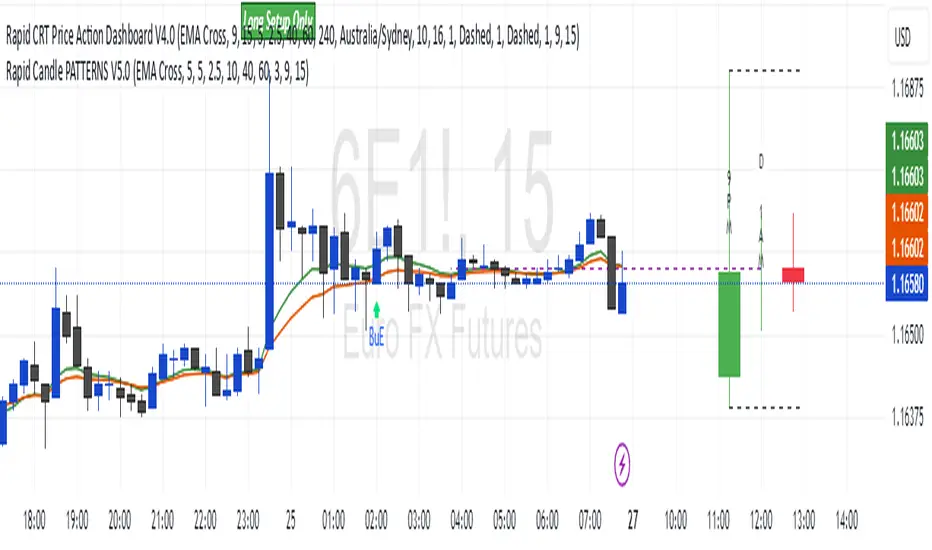
Rapid CRT Price Action Dashboard V4.0 - The Context & Conviction UpdateHello traders!
After extensive development and testing, I'm thrilled to announce a monumental upgrade, taking the dashboard directly from V2.0 to V4.0. This isn't just an update; it's a complete re-engineering of the indicator's "brain" to transform it from a simple pattern spotter into a professional-grade setup-filtering engine.
V4.0 is built around two core principles: Context & Conviction. It's designed to stop you from taking good patterns in bad locations by ensuring every signal is aligned with the market's underlying momentum and backed by a sound analytical thesis.
What's New & Improved in V4.0? (The Leap from V2.0)
This version is a quantum leap forward, introducing a sophisticated suite of filters and visual tools inspired by professional price action concepts.
- [] The Trend Filter Engine (New!): The flagship feature of V4.0. You can now automatically filter all pattern signals based on the trend, defined by two integrated EMAs on the higher timeframe. This is designed to eliminate weak, counter-trend signals and keep you trading with the market's flow. [] 'Effortless Reversal' Volume Logic (New!): We've completely reversed the conventional wisdom on volume. The engulfing pattern logic now looks for a reversal on LOWER volume, identifying true trend exhaustion and a more reliable change in direction. [] Complete V4.0 Pattern Engine: We've moved far beyond the simple logic of V2.0. Every pattern is now a "setup" with its own set of advanced, contextual filters (more details below). [] The CRT Dashboard Visuals: The dashboard now features the "CRT Market Profiles" layout, with intelligent projection lines and vertical time labels inside the mini-candles. [] Full Customization: V4.0 adds a huge number of new settings, allowing you to fine-tune every aspect of the new pattern logic, line styles, and timezones to create your own unique edge. [] Integrated EMAs: Two configurable EMAs have been added, providing an instant view of the underlying trend and powering the new Trend Filter.
The Logic: A Deep Dive into the V4.0 Engine
The power of V4.0 is its ability to distinguish between a simple "pattern" and a true "setup." Here’s how the new logic works:
The Trend Filter Engine A perfect pattern in the wrong trend is often a losing trade. This new engine ensures you're always aligned with market momentum.
- [] "EMA Cross" Mode: Only shows bullish signals if the fast HTF EMA is above the slow HTF EMA. [] "Price Position" Mode: A stricter filter that only shows bullish signals if the HTF price is trading above both EMAs.
Swing Hammers (H / IH) No longer just a candle with a long wick.
- [] Swing Point Confirmation: A Hammer is only valid if it forms at a swing low over a user-defined lookback period. This ensures the signal occurs at a potential structural turning point. [] Wick Dominance Ratio: Enforces a minimum wick-to-body ratio, guaranteeing the candle represents a powerful and decisive rejection. [] Liquidity Grab: Confirms that the candle's wick has taken liquidity by piercing beyond the prior candle's high or low.
- [] Momentum Context: A Harami is only valid if the first candle has a larger-than-average body size, proving that it is interrupting a genuine trend. [] Positional Filter: The Harami is only valid if it forms in the upper half (for bearish) or lower half (for bullish) of the prior candle's range, pinpointing more significant failures of momentum.
- [] "No-Doubt" Body Filter: The engulfing candle must have a large, dominant body, filtering out signals with long, contradictory rejection wicks. [] News Spike Filter: Automatically ignores enormous "news spike" candles that are too large relative to the recent average candle size. [] Power Close: We still require the candle to close decisively beyond the high/low of the prior candle, confirming a true breakout of the structure.
How To Use It (V4.0 Workflow)
The Rapid CRT Price Action Dashboard V4.0 is your complete tool for building a high-probability trading narrative.
- [] Set Your Trend Context: In the settings, configure your EMAs and choose your preferred Trend Filter mode. [] Frame the Market: Use the Range Lines from Candle A to define the key high and low for the current structure. [] Identify Your Setup: Use the Setup Line from Candle B's close as your critical reference point or "invalidation" level. [] Wait for Aligned Confirmation: Look for a high-probability pattern signal to appear on the dashboard. With V4.0, you can be confident that any signal you see has already been filtered to align with your chosen trend direction, dramatically improving its reliability.
Disclaimer
This indicator is for educational and informational purposes only and should not be considered financial advice. Trading involves substantial risk and is not suitable for all investors. The user of this tool is solely responsible for all their trading decisions.
Nota Keluaran
We have updated the Hammer candle logic by adding volume to it. Now the hammer will work like Effort Vs Result (EVR). So hammer or IH has to bigger volume then the previous candle. Nota Keluaran
Sorry about the last update as it was wrongfully done on the Harami logic portion of the code. The volume confirmation in now with Hammer signal. Which will correctly follow EVR.Nota Keluaran
Brief update of version 4: Reduce HTF “repaint/flicker” and get true HTF EMAsRight now code compute ema3/ema4 on resampled LTF closes. That’s fine, but it’s not identical to the actual EMAs of the higher timeframe. Also, while an HTF bar is forming, the values can drift intra-bar, which means a breakout could be allowed/blocked and then flip back.
1. Trend Filter Integration
- Added configurable Trend Determination system: Modes: Disabled, Long Only, Short Only, EMA Cross, Price Position.
- The system references a higher timeframe (user-selectable) to validate trade direction.
- Prevents counter-trend breakouts by filtering against the dominant market bias.
2. True Higher Timeframe Confirmation
The EMAs and trend direction now use confirmed higher-timeframe data, meaning:
- No intra-bar flicker or early flips while the higher-timeframe candle is still forming.
- Trend direction remains stable and reliable until the higher-timeframe bar closes.
3. New Optional Modes
- Long-Only / Short-Only modes allow strategy isolation for bullish or bearish environments.
- Price-Position mode uses actual price position relative to both EMAs (instead of just their cross).
Why this helps
We are now using the actual EMAs of the HTF, not a resampled approximation.
htfConfirmed prevents intra-HTF whipsaw in the filter (less “permission flicker” on live bars).
Skrip dilindungi
Skrip ini diterbitkan sebagai sumber tertutup. Akan tetapi, anda boleh menggunakannya dengan percuma dan tanpa had – ketahui lebih lanjut di sini.
Penafian
Maklumat dan penerbitan adalah tidak dimaksudkan untuk menjadi, dan tidak membentuk, nasihat untuk kewangan, pelaburan, perdagangan dan jenis-jenis lain atau cadangan yang dibekalkan atau disahkan oleh TradingView. Baca dengan lebih lanjut di Terma Penggunaan.