PROTECTED SOURCE SCRIPT
NY Reversal Pattern Stats
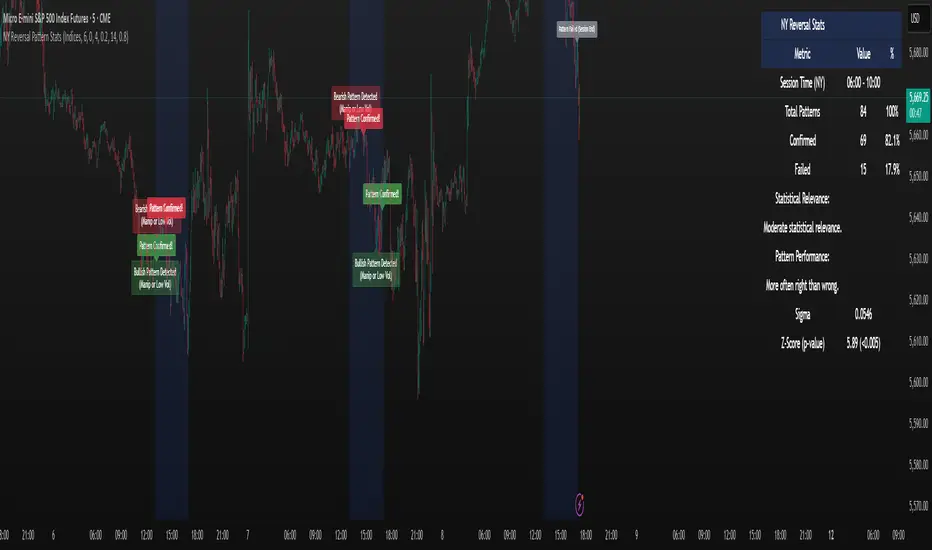
The NY Reversal Pattern Stats indicator is a tool for identifying and analyzing specific price action patterns that occur during the New York trading session. Its goal is to highlight potential reversal or continuation opportunities that may arise from market manipulation or shifts in volatility within this key market window. Beyond simply identifying patterns, the indicator provides valuable historical statistics on their performance, helping traders evaluate their effectiveness.
Key Features
New York Session Highlighting: Clearly visualizes the defined New York trading session directly on your chart.
Automated Pattern Detection: Automatically detects two types of patterns within the New York session:
Manipulation Wick: Identifies instances where price attempts to push significantly beyond a recent session extreme but is rejected, resulting in a wick with the close returning to the original side.
Low Volatility Reversal: Detects price interaction with a recent session extreme where the resulting candle shows lower-than-average volatility, suggesting potential exhaustion or a reversal point.
Pattern Confirmation Tracking: Tracks whether a detected pattern leads to a follow-through move based on a defined confirmation rule (currently, price returning to the session midpoint).
Comprehensive Statistics Table: Displays a detailed table on the chart summarizing:
Total patterns observed.
Number of patterns that were confirmed.
Success and failure rates.
Maximum losing streak.
Statistical relevance metrics (Sigma, Z-Score, P-value) to help assess if the observed success rate is likely due to chance.
A clear description interpreting the statistical relevance and pattern performance (more often right/wrong).
Customizable Visuals: Allows users to control the appearance of the session background and pattern labels.
Alerts: Provides options to set alerts when a new pattern is detected or when a detected pattern is confirmed.
How to Use the Indicator
Add to Chart: Apply the "NY Reversal Pattern Stats" indicator to your desired chart in TradingView.
Configure Inputs: Open the indicator's settings to customize the parameters:
Session Time Definition: Set the exact start hour, minute, and duration (in hours) for the New York session you wish to analyze. Use the "NY Time" inputs (e.g., 6:00 AM - 10:00 AM for Indices, 5:00 AM - 9:00 AM for Forex). The indicator uses the "America/New_York" timezone to handle Daylight Saving Time.
NY Session Visuals: Choose whether to display the session background and pattern labels, and customize their colors.
Pattern Detection: Adjust the sensitivity of the Manipulation Wick threshold and configure the settings for the Low Volatility Reversal pattern detection (enable/disable, ATR length, volatility factor).
Confirmation: Enable or disable the session midpoint confirmation criterion.
Show Statistics Table: Toggle the visibility of the statistics table.
Interpret the Chart: Observe the highlighted New York session windows and the labels indicating detected and confirmed patterns.
Analyze the Statistics Table: Refer to the statistics table for historical performance data.
Total Patterns: Indicates the sample size. More patterns generally lead to more statistically reliable results.
Confirmed/Failed: Shows the raw counts of successful and unsuccessful patterns based on the confirmation rule.
Success/Fail Rate (%): Provides the percentage of patterns that met or did not meet the confirmation criterion.
Statistical Relevance: Read the description provided in the table. It interprets the Z-Score and sample size to tell you if the observed success rate is statistically significant (i.e., unlikely to be just random chance).
Pattern Performance: Read the description indicating whether the pattern has historically been "More often right than wrong" or "More often wrong than right" based on the success rate.
Sigma / Z-Score / P-value: These are standard statistical measures. A higher absolute Z-Score and a lower P-value (especially below 0.05 or 0.01) suggest stronger statistical evidence that the pattern's success rate is different from a random 50/50 outcome.
Set Alerts: If desired, configure alerts to be notified when patterns are detected or confirmed, allowing you to potentially take action in real-time.
Interpretation of Results
High Success Rate + High Statistical Relevance: This combination suggests the detected pattern, as defined and confirmed by the indicator, has historically shown a consistent edge within the specified New York session window, and this performance is unlikely due to random chance.
High Success Rate + Low Statistical Relevance: The pattern has performed well in the observed data, but the sample size might be too small for high confidence that this performance will continue.
Low Success Rate + High Statistical Relevance: The pattern, as defined, has historically shown a tendency to fail more often than succeed, and this underperformance is statistically significant.
Low Statistical Relevance (Regardless of Success Rate): The sample size is insufficient to draw strong conclusions about the pattern's effectiveness. More historical data is needed.
Remember that past performance is not indicative of future results. Statistical analysis provides insights into historical tendencies, but trading decisions should always involve a comprehensive analysis and risk management plan.
Limitations
Timeframe Dependency: The pattern detection and session high/low accumulation operate on the chart's current timeframe. It does not specifically analyze only the 4-hour candles as might be implied by "4H Candle Profiling Patterns".
Confirmation Criterion: The confirmation rule is fixed to price returning to the session midpoint. If your strategy uses a different confirmation or target, this indicator's statistics may not directly reflect its performance.
No London/Asia Filter: The indicator does not check the performance or characteristics of the London or Asia sessions to filter for instances where "London and Asia Fail".
Potential Timezone Compiler Issues: While the code uses standard v6 timezone handling, some specific TradingView environments may exhibit unexpected behavior with timezone strings, potentially affecting the precise timing of the session boundaries.
This indicator is a powerful tool for analyzing specific price action patterns during the New York session. By understanding its inputs, outputs, and limitations, traders can gain valuable insights into potential trading opportunities.
Skrip dilindungi
Skrip ini diterbitkan sebagai sumber tertutup. Akan tetapi, anda boleh menggunakannya secara bebas dan tanpa apa-apa had – ketahui lebih di sini.
Penafian
Maklumat dan penerbitan adalah tidak bertujuan, dan tidak membentuk, nasihat atau cadangan kewangan, pelaburan, dagangan atau jenis lain yang diberikan atau disahkan oleh TradingView. Baca lebih dalam Terma Penggunaan.