OPEN-SOURCE SCRIPT
Telah dikemas kini [JHF] Trend Probability Indicator
This is a probability indicator that aggregates binary signals (1, -1) from 13 indicators:
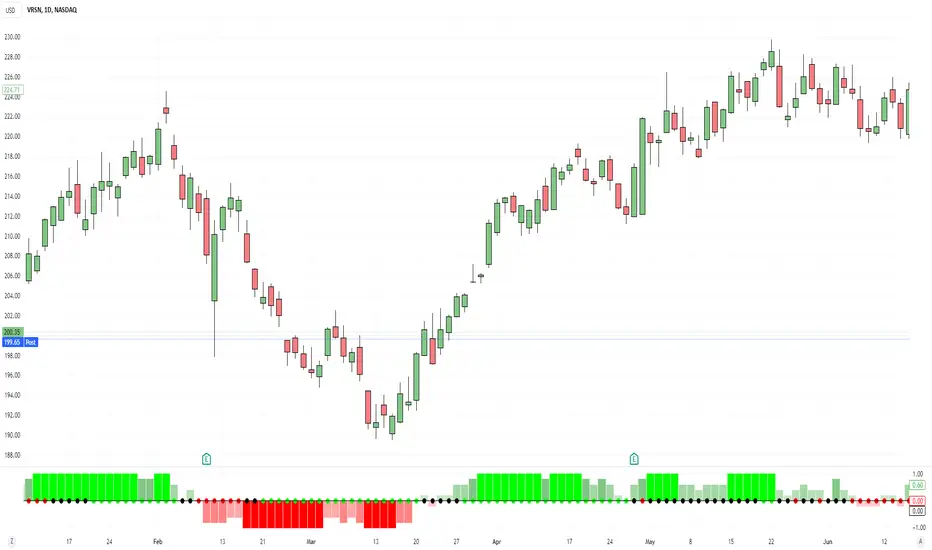
The final value of the binary indicator is the the sum of all these binary signals, divided by the number of enabled indicators (between 1 and 13 for the moment). The plotted line is green when the value is above 0 and red when it's below 0. The area between the line and the zero level is also filled with the corresponding color to display the signal's strength.
Lately, a new option has been added to swap the colored dots on the zero-line to Makit0's Squeeze Pro Indicator, which indicates potential squeezes.
- 3 SMA: Simple Moving Average.
- 3 TRAMA: A moving average that adapts to the average number of highest high/lowest low made over a specific period, thus adapting to trend strength.
- Aroon: This indicator measures the strength and momentum of a trend by comparing the closing prices to the highs and lows over a specific period. A bullish signal is represented by 1 and a bearish signal by -1.
- DMI (Directional Movement Index): This indicator measures the strength of upward and downward movements. A value of 1 represents a strong upward movement, while -1 represents a strong downward movement.
- MACD (Moving Average Convergence Divergence): This is a trend-following momentum indicator that shows the relationship between two moving averages of a security's price. A value of 1 indicates that the short-term average is above the long-term average (bullish), while -1 indicates the opposite (bearish).
- Parabolic SAR (Stop and Reverse): This indicator provides potential entry and exit points. A value of 1 indicates a bullish trend, while -1 indicates a bearish trend.
- RSI (Relative Strength Index): This momentum oscillator measures the speed and change of price movements. A value of 1 indicates overbought conditions (bullish), while -1 indicates oversold conditions (bearish).
- SMI Ergodic Indicator: This oscillator identifies trend direction and strength. A value of 1 indicates upward momentum, while -1 indicates downward momentum.
- Supertrend: This trend-following indicator is based on the volatility of the asset. A value of 1 indicates a bullish trend, while -1 indicates a bearish trend.
The final value of the binary indicator is the the sum of all these binary signals, divided by the number of enabled indicators (between 1 and 13 for the moment). The plotted line is green when the value is above 0 and red when it's below 0. The area between the line and the zero level is also filled with the corresponding color to display the signal's strength.
Lately, a new option has been added to swap the colored dots on the zero-line to Makit0's Squeeze Pro Indicator, which indicates potential squeezes.
Nota Keluaran
Cleaned code.Nota Keluaran
Fixed regression caused by last update.Nota Keluaran
Added the possibility to enable or disabled each subcomponent individually.Nota Keluaran
Added FeaturesThree Simple Moving Averages (SMA) to the Indicators: The code now includes three different Simple Moving Averages (SMA) - SMA 9, SMA 21, and SMA 50. Each SMA is calculated over a different length of time, providing a variety of trend data.
Each SMA can be individually enabled or disabled. This allows users to customize which SMAs they want to include in their analysis.
Each enabled SMA contributes a weight of 1 towards the total weight of all enabled indicators.
Nota Keluaran
Fixed Issues- Disabling one or many SMA does not break the indicator anymore.
New Features
- Updated default style to histogram.
- Changed default colors, strong colors and transparency grading.
- Added colored circles on the zero line for those that prefer hiding the histogram
- Added possibility to change Histogram to something else in the Style tab (i.e.: line breaks)
Nota Keluaran
- Clarified Global Length switch
- Added TRAMA to subcomponents as an alternative to regular SMA (disabled by default)
- Cleaned up inputs section a little bit
Nota Keluaran
- Performance optimization, most subcomponents code is not ran when they are not enabled.
- More element are now affected by the global Length parameter.
- Standardized code and variables for easier reading and management.
Nota Keluaran
Fixed Issues- Fixed regression with TRAMA weights being incorrectly calculated.
- Regression: TRAMA warnings for non-boolean comparison with "or" are back for the moment.
Nota Keluaran
New Component- Squeeze Pro Indicator by Makit0
- Disabled by default.
- Does not affect weight calculations nor indicator strength.
- Only replaces the dots on the zero line to detect squeezes.
Nota Keluaran
Updated Indicator name and code comments.Nota Keluaran
Fixed TRAMA calculations (again? Unwanted regression happened somewhere).Nota Keluaran
Updated title and short title for clarity.Nota Keluaran
Updating private script again because TradingView House Rules on public scripts are subjective and unfair. You cannot aggregate multiple indicators together without a good reason... look at the amount of public "Double MA" and "Triple MA" indicators there are out there.I was trying to help people out with my indicators, I learned my lesson. Everything will be private or invite-only from now on.
The Trend Probability Indicator [JHF] is a sophisticated tool that leverages the power of multiple sub-indicators to provide a comprehensive view of market trends. Each sub-indicator, from SMA to Supertrend, contributes unique insights into market behavior, such as trend strength, momentum, and volatility. By aggregating binary signals from these sub-indicators, the Trend Probability Indicator [JHF] creates a holistic picture of market dynamics. This aggregation allows for a nuanced interpretation of market trends, as it combines the strengths of each sub-indicator to mitigate their individual limitations. The outcome is a more reliable and robust indicator of market trends, providing traders with a valuable tool for making informed decisions.
Aggregating weighted values from multiple indicators can provide a more comprehensive and nuanced understanding of market trends. Each indicator provides a unique perspective on market behavior, and by combining them, you can capture a wider range of market dynamics.
Let’s consider a few examples based on the sub-indicators you mentioned:
SMA (Simple Moving Average): This indicator provides a smoothed line of past price movements and is often used to identify trend direction. However, it may lag behind real-time price changes because it’s based on past data.
MACD (Moving Average Convergence Divergence): This indicator shows the relationship between two moving averages and can signal potential buy or sell opportunities. It’s more responsive to recent price changes than SMA.
RSI (Relative Strength Index): This momentum oscillator measures the speed and change of price movements. It can identify overbought or oversold conditions, which may signal a potential price reversal.
By aggregating these indicators, you can gain a more complete picture of the market. For example, if the SMA and MACD both indicate an upward trend, but the RSI suggests the asset is overbought, this could signal that the upward trend may soon reverse. This combined insight might be missed if you were looking at each indicator in isolation.
In the “Trend Probability Indicator [JHF]”, the aggregation of binary signals from these indicators provides a single value that reflects the consensus across multiple indicators. This can help to confirm the strength of a signal and reduce the likelihood of false signals. For instance, if most indicators give a bullish signal (1), the final value will be positive, indicating a strong bullish trend. Conversely, if most indicators give a bearish signal (-1), the final value will be negative, indicating a strong bearish trend. This aggregated signal can provide a more reliable basis for trading decisions.
Other changes:
- SQZPRO by Makit0 is now enabled by default.
Nota Keluaran
- Moved Squeeze Pro parameters at the top of the input parameters.
- Added the possibility to customize SQZPRO colors
- Named the plots so they can be used in alerts based on the indicator
- Added negative values to the Squeeze Dots so you can plan alerts based on the Squeeze Dots plot "Value":
- No Squeeze: 0.0
- Low Squeeze: -0.01
- Medium Squeeze: -0.02
- Maximum Squeeze: -0.03
Nota Keluaran
Added a Very Tight Squeeze to SQZPRO, testing to see if results can be obtained with it.Default color is white, can be changed in the settings.
Skrip sumber terbuka
Dalam semangat TradingView sebenar, pencipta skrip ini telah menjadikannya sumber terbuka, jadi pedagang boleh menilai dan mengesahkan kefungsiannya. Terima kasih kepada penulis! Walaupuan anda boleh menggunakan secara percuma, ingat bahawa penerbitan semula kod ini tertakluk kepada Peraturan Dalaman.
The Real World - Stocks Campus:
Stocks, Options, Futures, Forex, Crypto, this is what we trade.
Learn profitable trading systems or build your own, just like I did.
jointherealworld.com/?a=tkbmft8bqf
Stocks, Options, Futures, Forex, Crypto, this is what we trade.
Learn profitable trading systems or build your own, just like I did.
jointherealworld.com/?a=tkbmft8bqf
Penafian
Maklumat dan penerbitan adalah tidak bertujuan, dan tidak membentuk, nasihat atau cadangan kewangan, pelaburan, dagangan atau jenis lain yang diberikan atau disahkan oleh TradingView. Baca lebih dalam Terma Penggunaan.