OPEN-SOURCE SCRIPT
Telah dikemas kini SAT - Sentiment Analysis Tool by Csth97
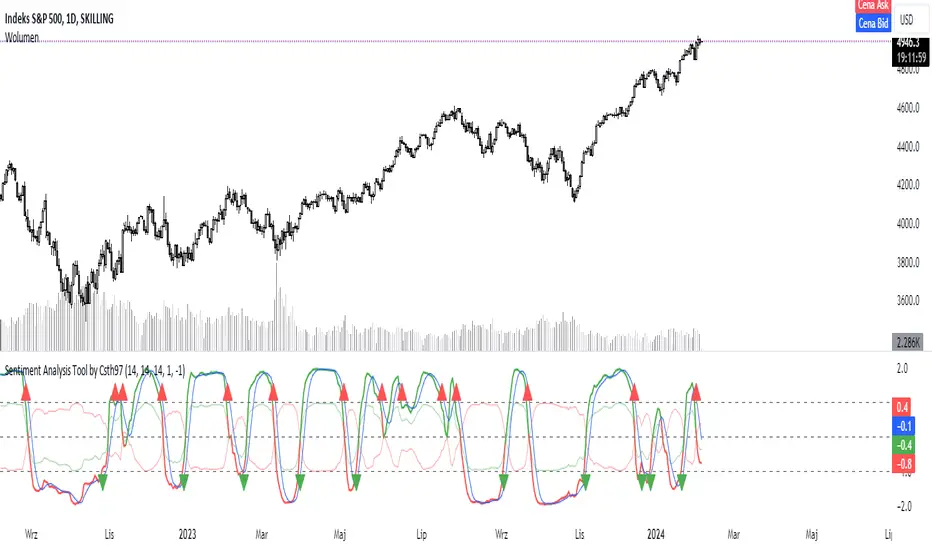
This code calculates the correlation between the ATR and the OBV of the price, and plots the difference between the positive and negative OBV correlations as a line. It also plots horizontal lines at the UP and DOWN levels, and signals bullish and bearish crosses when the difference line crosses those levels.
Nota Keluaran
// This code calculates the correlation between the ATR and the OBV of the price, and plots the difference between the positive and negative OBV correlations as a line.//It also plots horizontal lines at the UP and DOWN levels, and signals bullish and bearish crosses when the difference line crosses those levels.
Skrip sumber terbuka
Dalam semangat TradingView sebenar, pencipta skrip ini telah menjadikannya sumber terbuka, jadi pedagang boleh menilai dan mengesahkan kefungsiannya. Terima kasih kepada penulis! Walaupuan anda boleh menggunakan secara percuma, ingat bahawa penerbitan semula kod ini tertakluk kepada Peraturan Dalaman.
Penafian
Maklumat dan penerbitan adalah tidak bertujuan, dan tidak membentuk, nasihat atau cadangan kewangan, pelaburan, dagangan atau jenis lain yang diberikan atau disahkan oleh TradingView. Baca lebih dalam Terma Penggunaan.