B4Signals Ichimoku Premium Addon Kyushu Sushi Roll

<< Historical Context >>
During his time contributing market analysis to the Miyako Newspaper, traders faced the laborious task of manually recording daily open, close, high, and low price levels, alongside the five price values of Ichimoku (Tenkan sen, Kijun sen, Chiko span, Senko span A, Senko span B). With the absence of personal computers, this process was notably cumbersome. In response to traders' requests for a simplified analysis method, Goichi Hosoda introduced the Kyushu Ashi technique.
<< About Kyushu Ashi >>
Derived from Japanese, where "Kyu" denotes nine, "Shu" refers to week, and "Ashi" translates to candles, Kyushu Ashi aims to identify market reversals and trend continuations by leveraging Kihon Suchi time cycles. However, as stated in the original book, trading solely with Kyushu Ashi is not advisable; it is recommended to combine it with the Ichimoku's five lines for a comprehensive trading approach.
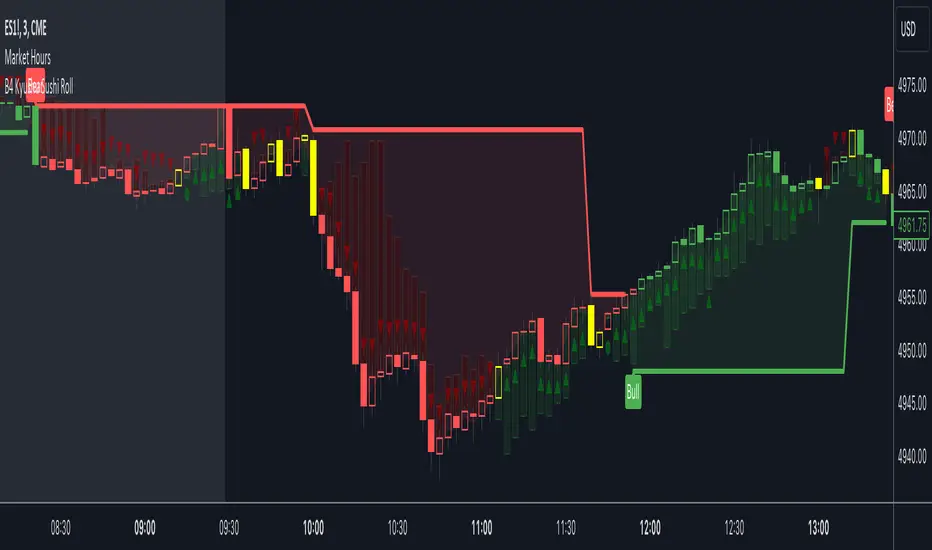
Our indicator enhances the Kyushu Ashi strategy by incorporating the original signals in a simplified manner showing up or down carrets in the legs. Additionally, it colors candles with no signals, enabling traders to spot areas of consolidation, continuation, and trend reversal effectively. Drawing inspiration from Fisher's Sushi Roll indicator, our tool identifies these trend changes and adds a trend cloud for the prevailing trend. This comprehensive approach maximizes the effectiveness of the Kyushu Ashi strategy and assists traders in making informed trading decisions.
This is an advanced version with the following features:
- Shows Kyushu Legs
- Shows Kyushu Leg signals
- Draws trend cloud based on Kyushu Legs
- Sends alerts when no Kyushu signal is present, alerting trader of consolidation
- Colors No Kyushu signal candles
- Draws dynamic consolidation zones for breakout identification
Skrip jemputan sahaja
Hanya pengguna yang diluluskan oleh penulis boleh mengakses skrip ini. Anda perlu memohon dan mendapatkan kebenaran untuk menggunakannya. Ini selalunya diberikan selepas pembayaran. Untuk lebih butiran, ikuti arahan penulis di bawah atau hubungi terus B4Signals.
TradingView tidak menyarankan pembayaran untuk atau menggunakan skrip kecuali anda benar-benar mempercayai penulisnya dan memahami bagaimana ia berfungsi. Anda juga boleh mendapatkan alternatif sumber terbuka lain yang percuma dalam skrip komuniti kami.
Arahan penulis
Penafian
Skrip jemputan sahaja
Hanya pengguna yang diluluskan oleh penulis boleh mengakses skrip ini. Anda perlu memohon dan mendapatkan kebenaran untuk menggunakannya. Ini selalunya diberikan selepas pembayaran. Untuk lebih butiran, ikuti arahan penulis di bawah atau hubungi terus B4Signals.
TradingView tidak menyarankan pembayaran untuk atau menggunakan skrip kecuali anda benar-benar mempercayai penulisnya dan memahami bagaimana ia berfungsi. Anda juga boleh mendapatkan alternatif sumber terbuka lain yang percuma dalam skrip komuniti kami.